Overview
After two years of COVID-19 tracking work, I have decided to end my project. Data collection is now frozen at 2022-03-31. This change does not reflect an assessment that COVID-19 is now behind us. On the contrary, I remain very concerned about the risk that new variants pose. However, changes that DHSS has made to their reporting posture have made continuing my work far more challenging. I had initially planned to end the project on 2022-05-09. DHSS’s new dashboard will continue to be a resource for the state but has greatly complicated the process I go through to update my own data.
I will be gradually transitioning some elements of this site to an archive of Missouri’s COVID-19 data over the next six weeks, so you may notice some changes if you return. However, I do not plan to update the underlying data sources again. Thank you so much to those of you who became regular visitors over the last two years. It’s been an absolute privilege to help my neighbors navigate the first two years of the pandemic. Be well! -Chris
Welcome to Chris Prener’s tracking site for the SARS-CoV-2 pandemic in Missouri. This site was updated nightly using data from a variety of federal, state, and local data sources as well as the New York Times’ COVID-19 Project. If you are new to the site, please read the About page for an overview of these data.
Vaccinations
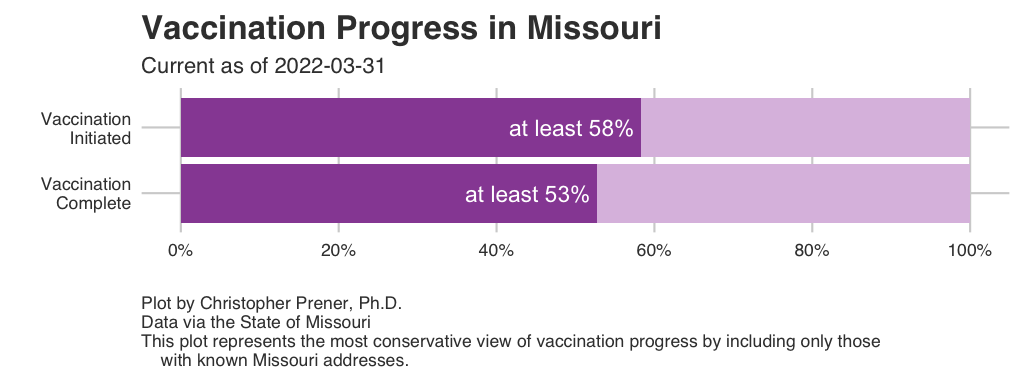
Initiated means individuals have received an initial dose of the Moderna or Pfizer vaccines, or the single dose of the Johnson & Johnson vaccine. Completed means individuals have received both doses of the Moderna or Pfizer vaccines, or the single dose of the Johnson & Johnson vaccine.
Additional vaccination maps, plots, and data about Missouri is available on our dedicated page.
Daily Data
While the City of St. Louis, St. Louis County, and Kansas City provide day-by-day tracking of cumulative cases on their respective dashboards, the State of Missouri does not. The following tabs provide daily breakdowns of COVID data as well as additional statistics not included in the existing dashboards. Data are also provided for the wider St. Louis and Kansas City metro areas. Please note that the two average columns for reported cases and deaths are both seven-day rolling averages.
Missouri
St. Louis Metro
City of St. Louis
St. Louis County
Kansas City Metro
Kansas City
Notes
- The underlying data for these maps are available from GitHub in the
county_full.csv,metro_full.csv, andstate_full.csvtables, which are assembled from data provided by the New York Times. - The FAQ contains a short explanation of per-capita rates.
- All averages presented are 7-day rolling averages.
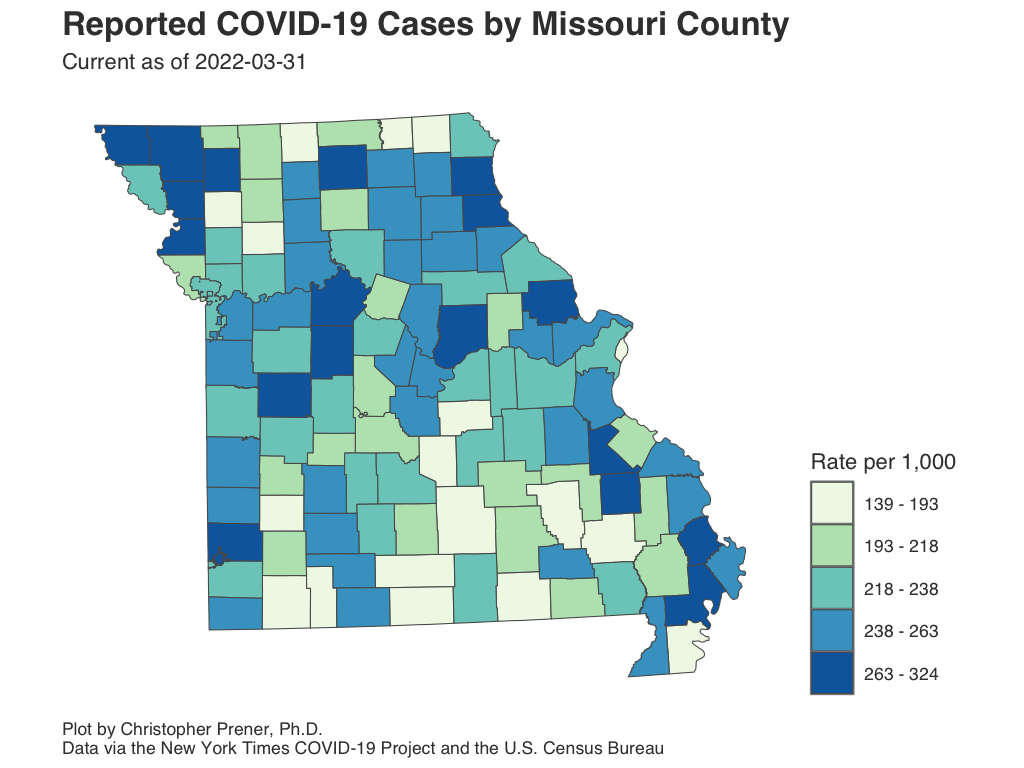
Infection Rates by County
This map shows infections as a rate per 1,000 residents. It is important not to map the raw counts themselves, but if you want to see those data, click on a county.
Interactive Map
Data Table
Notes
- The underlying data for these maps are available from GitHub in the
daily_snapshot_mo_xl.geojsonspatial data set, which is assembled from data provided by the New York Times. - The FAQ contains a short explanation of per-capita rates.
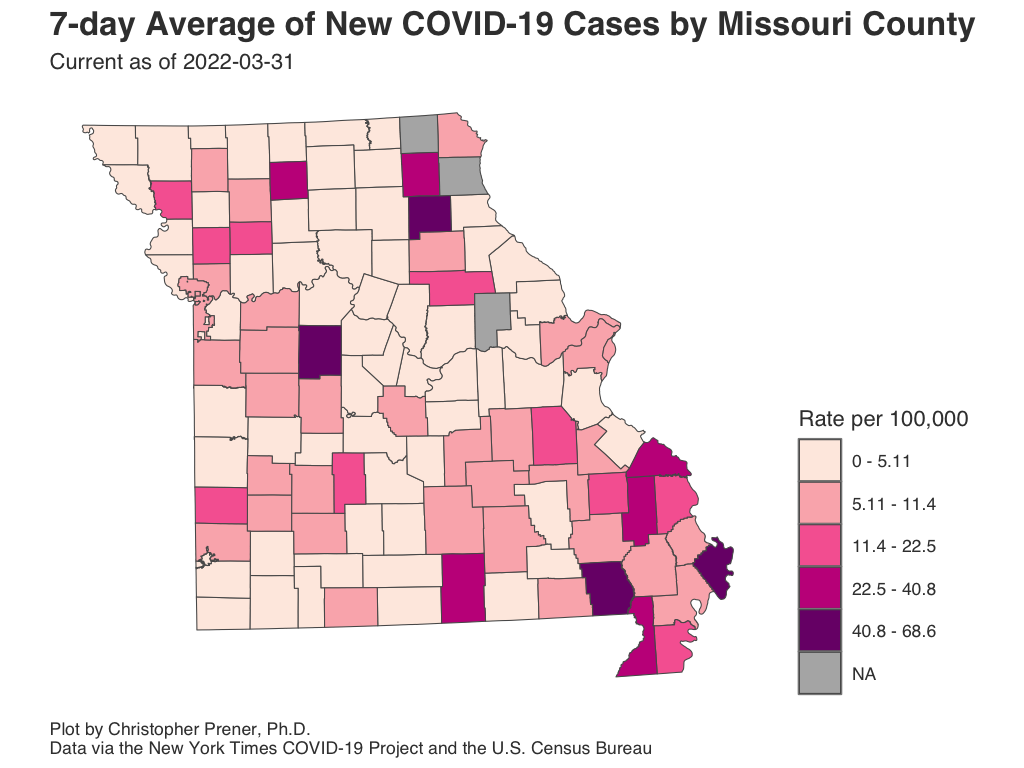
Average New Cases by County
This map shows a seven-day rolling average of new cases. For this map, this covers 2022-03-31 back through 2022-03-24. There is not a threshold for what constitutes a high or low average, but the higher the average number of new cases, the more new spread we can infer. For mapping purposes, these are displayed as a rate per 100,000 residents. As with the prior map, additional details are available by clicking on each county or on the data table.
Interactive Map
Data Table
Notes
- The underlying data for these maps are available from GitHub in the
daily_snapshot_mo_xl.geojsonspatial data set, which is assembled from data provided by the New York Times. - The FAQ contains a short explanation of per-capita rates.
- All averages presented are 7-day rolling averages.
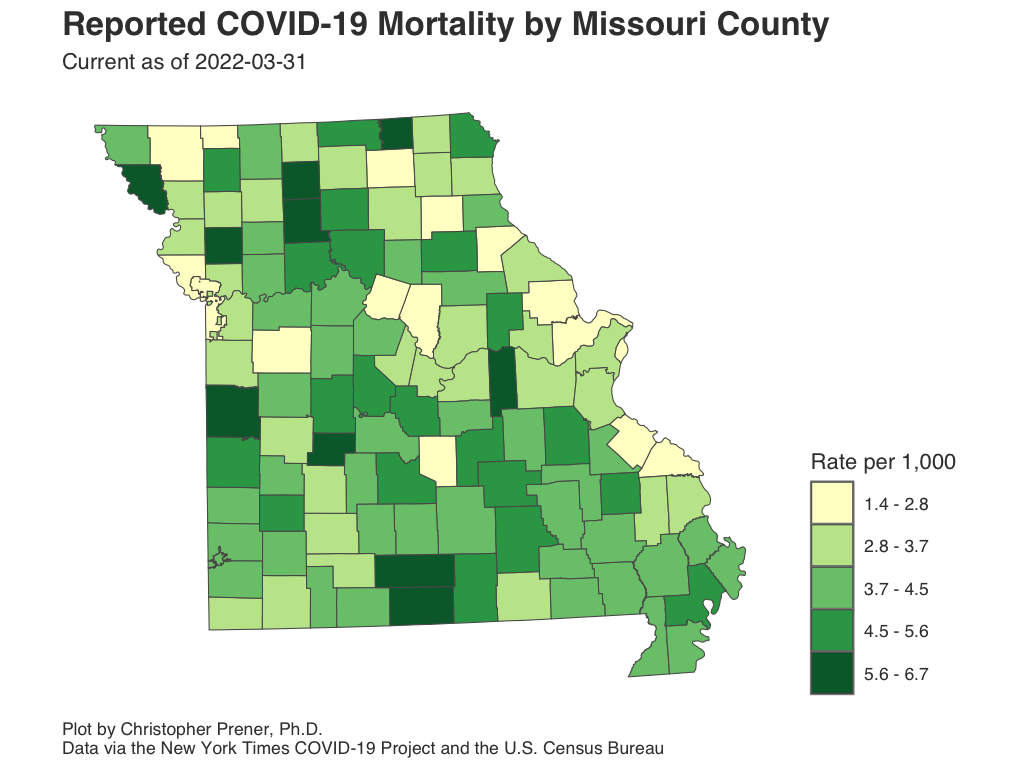
Mortality Rates by County
This map shows mortality as a rate per 1,000 residents. As with the prior maps, raw counts of deaths and hospital infrastructure details are available by clicking on individual counties or on the data table.
Interactive Map
Data Table
Notes
- The underlying data for these maps are available from GitHub in the
daily_snapshot_mo_xl.geojsonspatial data set, which is assembled from data provided by the New York Times. - The FAQ contains a short explanation of per-capita rates.
Additional Plots and Data
Data via Geographic Area
Additional data are available at the following geographic levels:
- Missouri and surrounding states
- Regions
- Metropolitan areas
- Counties statewide
- Cases and mortality are above
- Vaccinations
- Counties in the St. Louis and Kansas City metropolitan areas
- Counties in other regions of Missouri
- Zip codes in the St. Louis and Kansas City metropolitan areas
Data via Topic
Additional data are available for the following topics:
- Cases
- State; Region; Metropolitan areas; counties in St. Louis, Kansas City, and other regions of Missouri; Long Term Care facilities
- Disparities
- Cases and Deaths
- Vaccinations
- Excess Mortality
- Hospitalizations
- Long Term Care and Nursing Homes
- Mortality
- State; Metropolitan areas; counties in St. Louis, Kansas City; Long Term Care facilities
- Vaccinations
Contributors
Chris Prener, an Assistant Professor of Sociology at Saint Louis University, is the primary maintainer of this site and the data behind it. Tim Wiemken, an Associate Professor in Health and Clinical Outcomes Research and Infectious Disease at Saint Louis University School of Medicine, has contributed to both the mortality and nursing home data. He has also provided technical guidance on other aspects of the site.
In addition, Saint Louis University Computer Science majors Alvin Do, Eric Quach, and Metta Pham are all working on this site as part of the Senior Capstone project. Alvin, Eric, and Metta have contributed to building underlying data, especially ZIP code data, and are supporting the automation of web scraping. Big thanks are due to them, and to the Department of Computer Science for selecting this site for inclusion in its Senior Capstone program this year.
Copyright © 2020-2021 Christopher Prener, Ph.D. All code, data, website content, and images are available under a Creative Commons Attribution 4.0 International License.