State-level Data
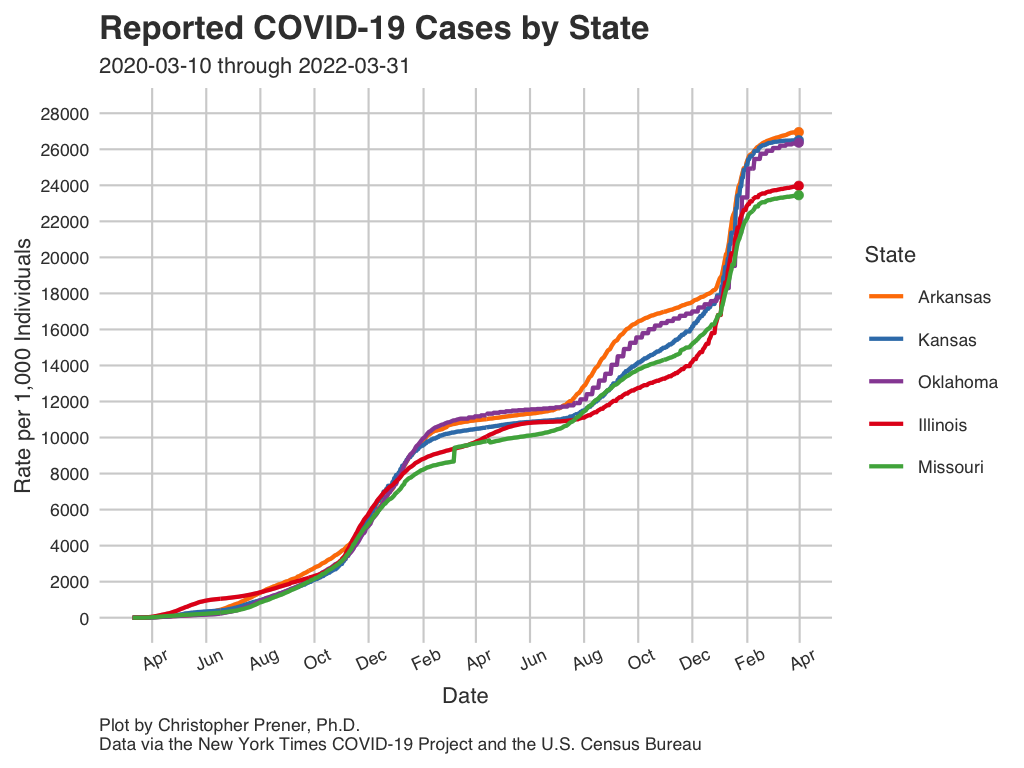
The following plots and maps focus on a number of states surrounding Missouri in order to provide a comparison for our own state-level trends. The focal states in this section are currently Arkansas, Illinois, Kansas, and Oklahoma in addition to Missouri itself.
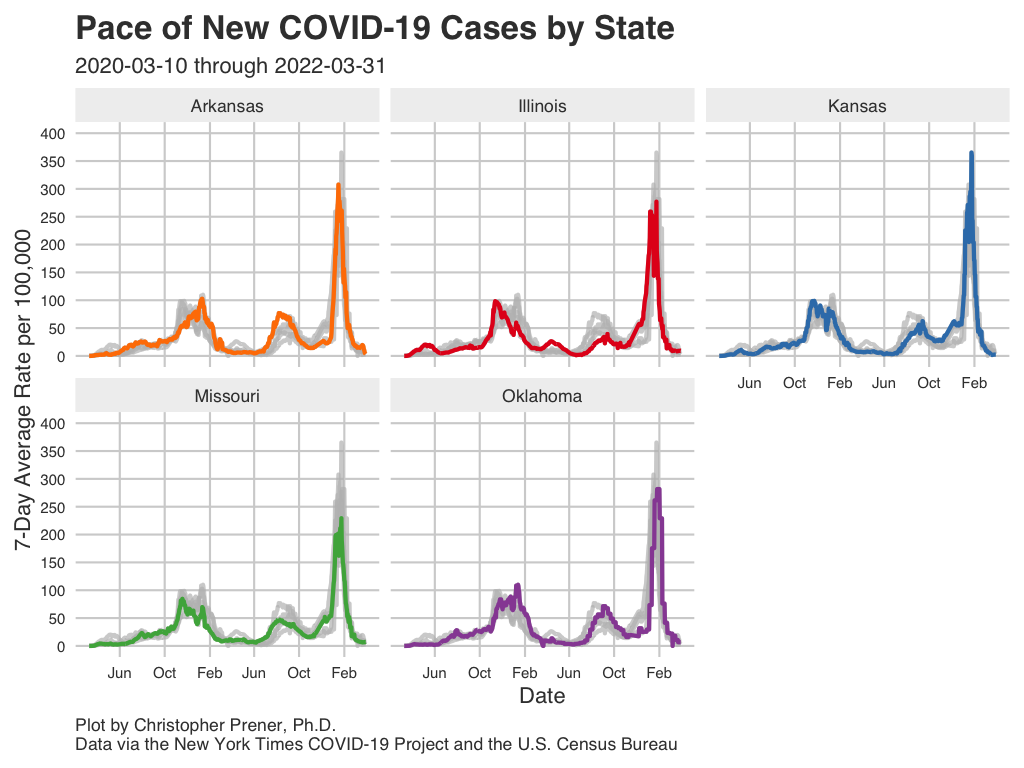
Infections
These plots show patterns in infections for the focal states.
Data Table
Notes
- The underlying data for these plots are available from GitHub in the
state_full.csvtable, which is assembled from data provided by the New York Times. - The FAQ contains short explanations of per-capita rates and log plots. Note that the rates presented for testing data are per 100,000 individuals.
- All averages presented are 7-day rolling averages.
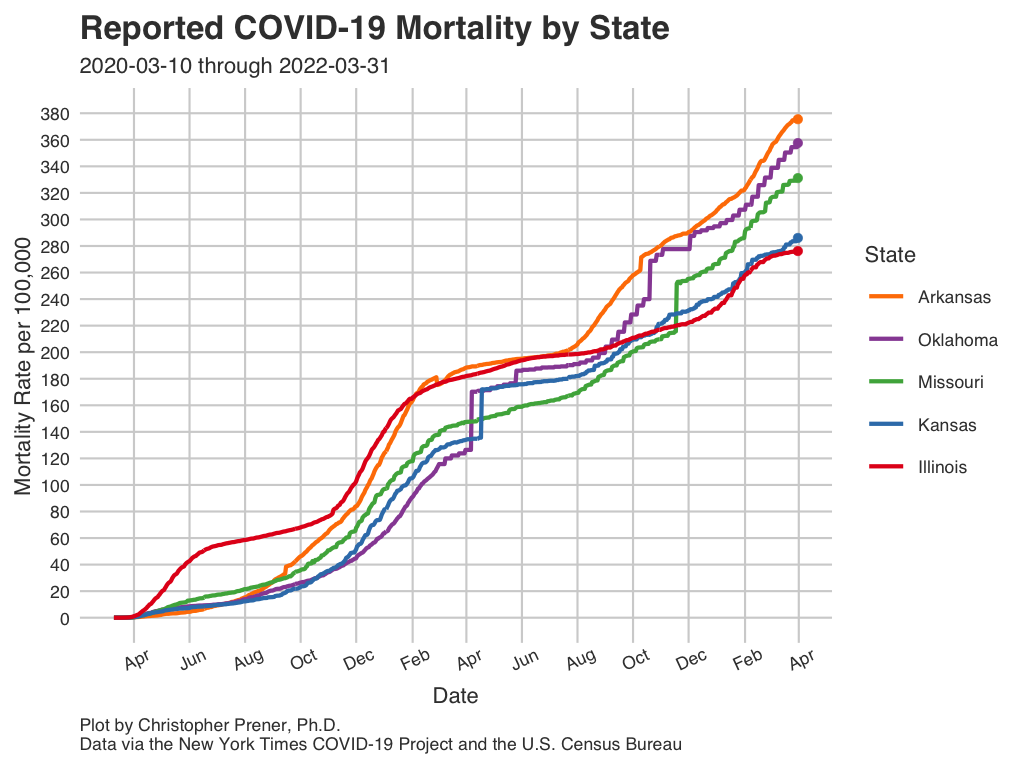
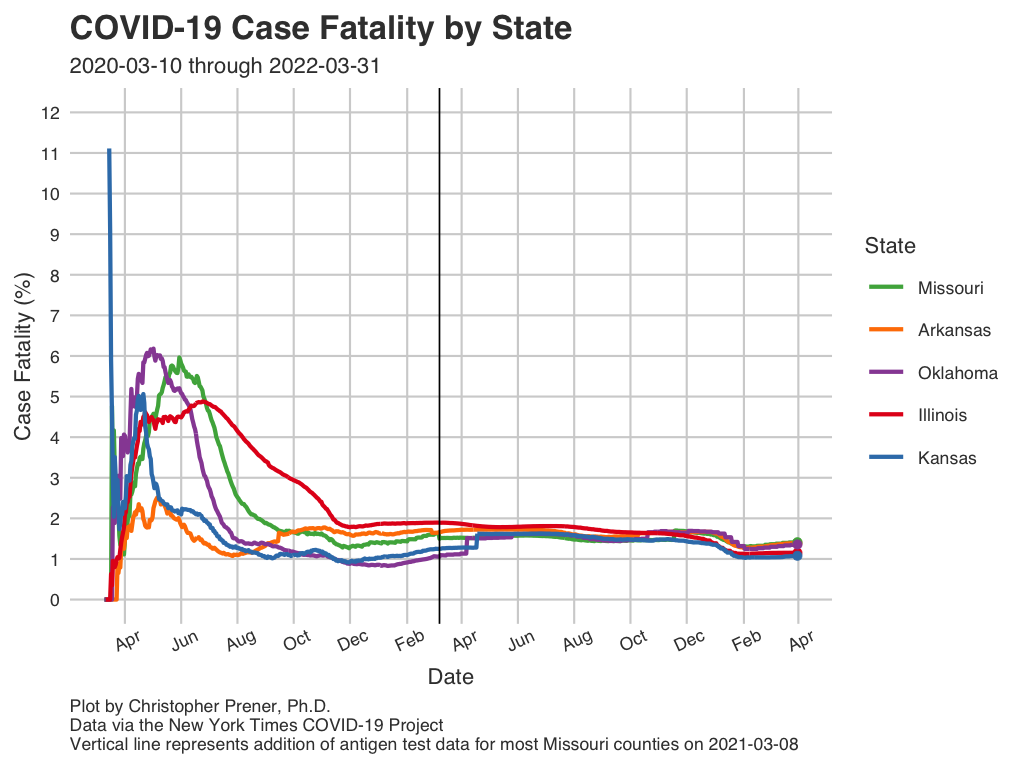
Mortality
These plots show patterns in deaths for the focal states.
Data Table
Notes
- The underlying data for these plots are available from GitHub in the
state_full.csvtable, which is assembled from data provided by the New York Times. - The FAQ contains short explanations of per-capita rates and log plots. Note that the rates presented for testing data are per 100,000 individuals.
- All averages presented are 7-day rolling averages.
- The abbreviation “CFR” states for case fatality rate (the number of deaths divided by the number of known cases, expressed as a percentage).
Copyright © 2020-2021 Christopher Prener, Ph.D. All code, data, website content, and images are available under a Creative Commons Attribution 4.0 International License.