Non-Metro Regions
The following plots focus on a number of regions around Missouri. Unlike the pages for St. Louis and Kansas City, these regions do not encompass officially designated regions. Rather, they attempt to group counties together based on geographic proximity.
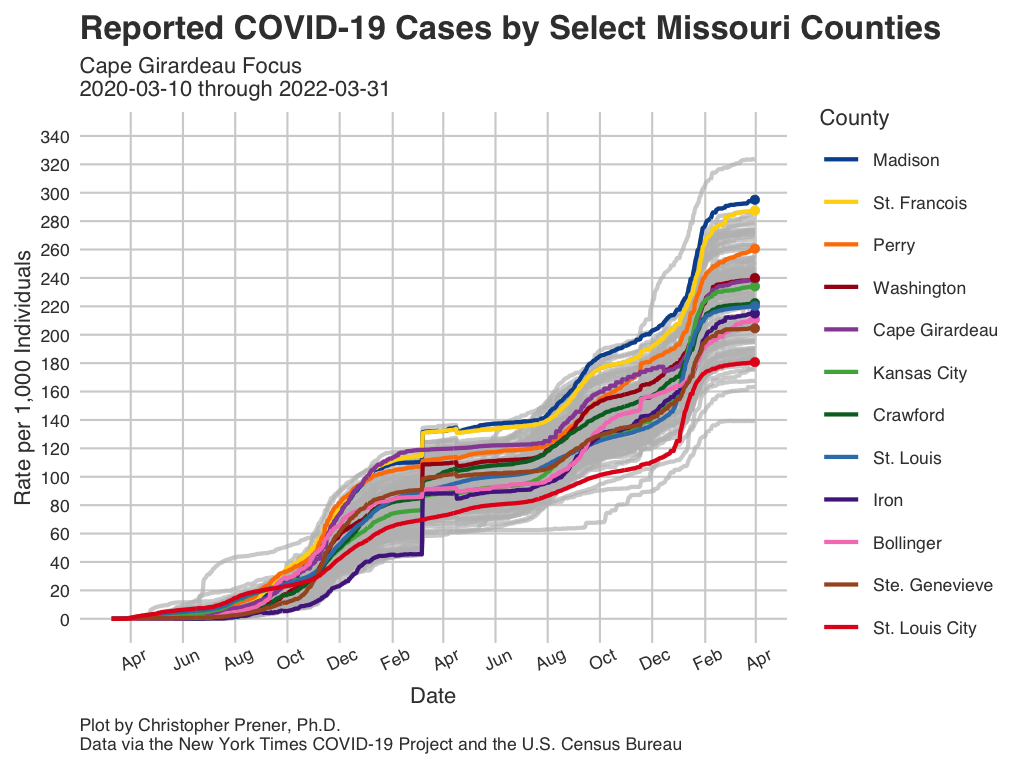
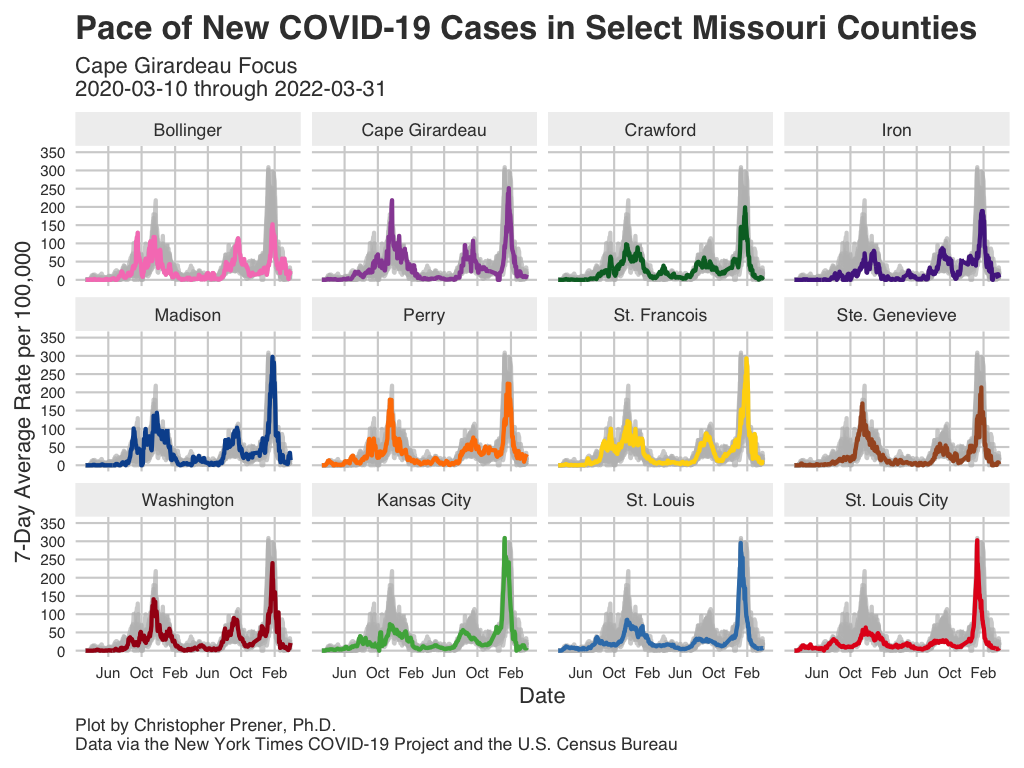
Cape Girardeau
These plots show patterns in infections for a number of counties in the Cape Girardeau region of Missouri, which lies along the Mississippi River to the south of St. Louis. These include some, but not all, of the counties in the Cape Girardeau metro area.
Data Table
Notes
- The underlying data for these plots are available from GitHub in the
county_full.csvtable, which is assembled from data provided by the New York Times. - The FAQ contains short explanations of per-capita rates and log plots.
- All averages presented are 7-day rolling averages.
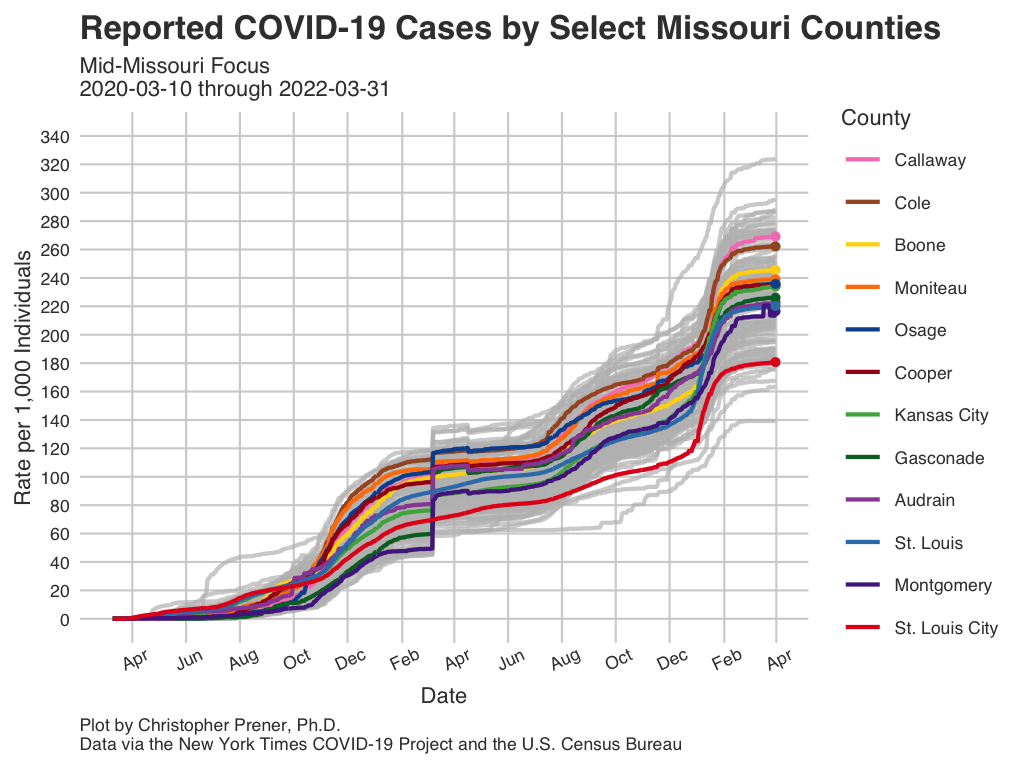
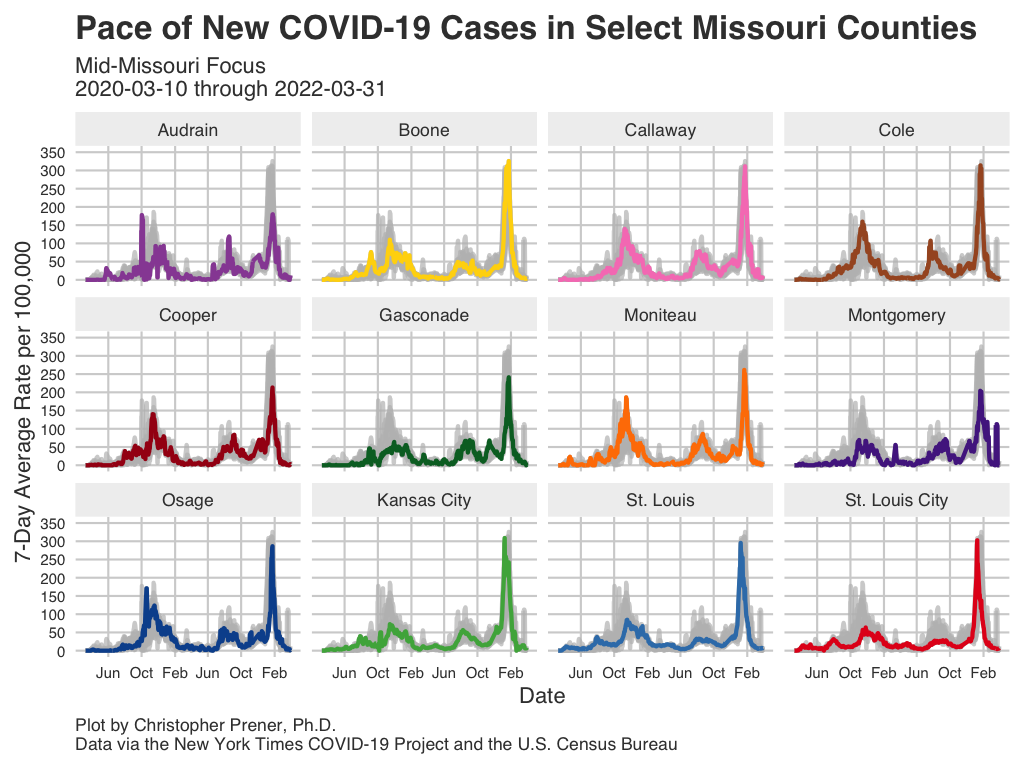
Mid-Missouri
These plots show patterns in infections for a number of counties in the Mid-Missouri region of Missouri, which lies along the Missouri River to the west of St. Louis and the east of Kansas City. These include some, but not all, of the counties in the Jefferson City and Columbia metro areas.
Data Table
Notes
- The underlying data for these plots are available from GitHub in the
county_full.csvtable, which is assembled from data provided by the New York Times. - The FAQ contains short explanations of per-capita rates and log plots.
- All averages presented are 7-day rolling averages.
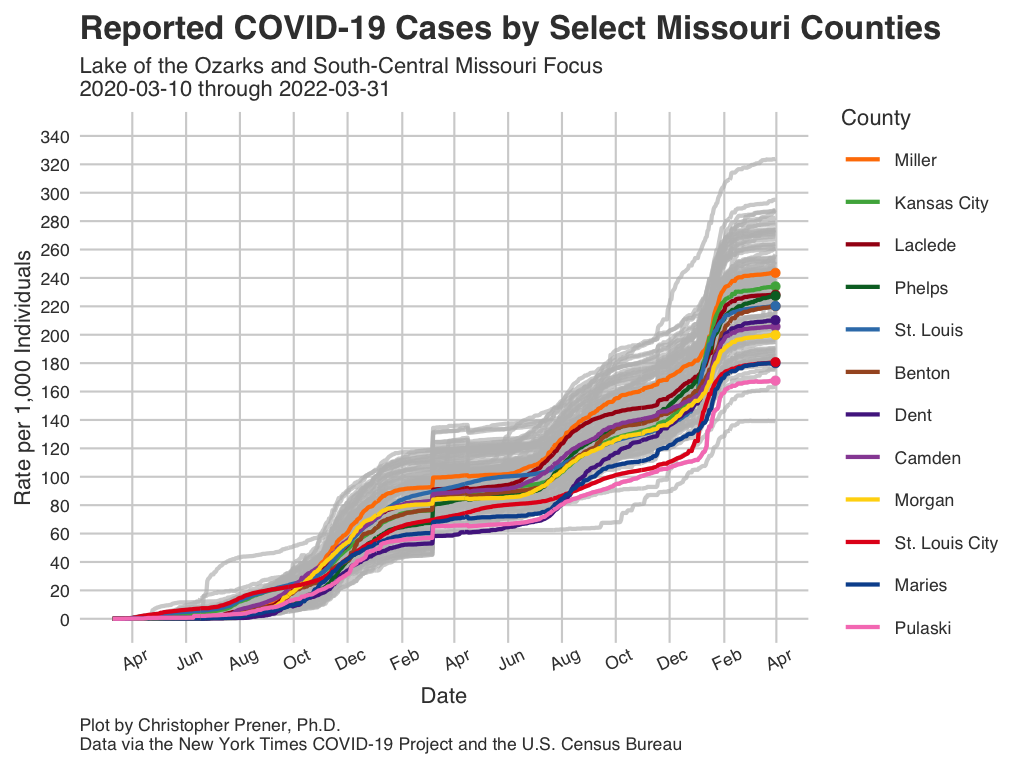
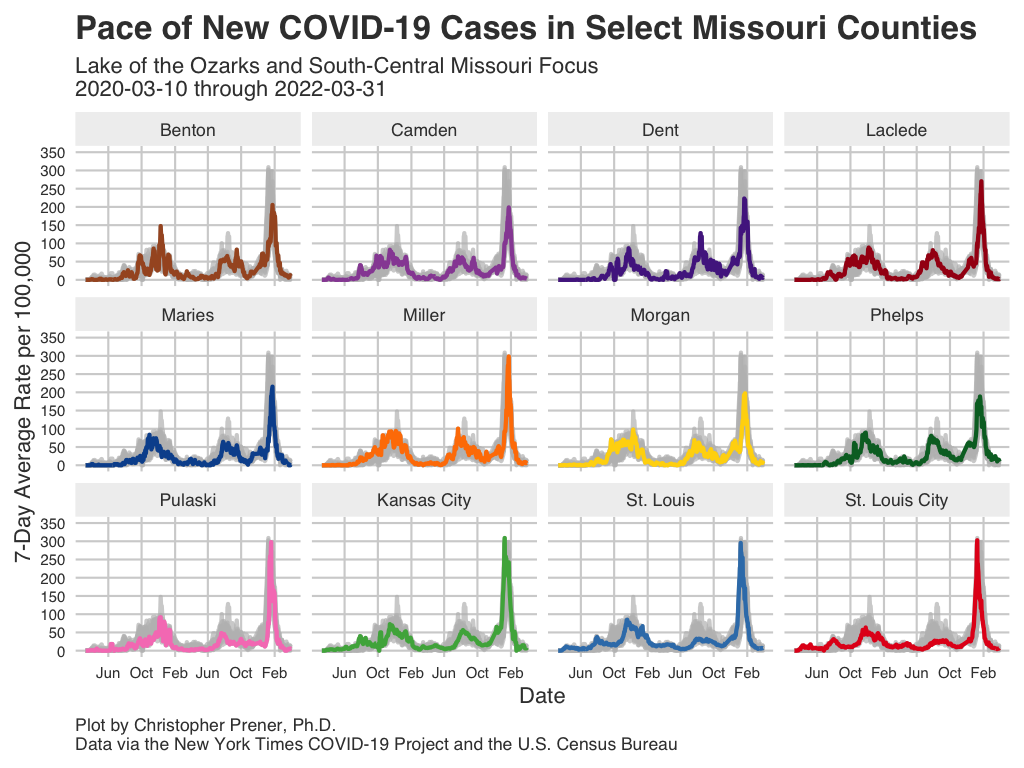
Lake of the Ozarks and South-Central Missouri
These plots show patterns in infections for a number of counties in central Missouri’s Lake of the Ozarks region. Camden County is the primary county at the heart of the region, containing much of Osage Beach, MO. These counties are south of the Mid-Missouri region.
Data Table
Notes
- The underlying data for these plots are available from GitHub in the
county_full.csvtable, which is assembled from data provided by the New York Times. - The FAQ contains short explanations of per-capita rates and log plots.
- All averages presented are 7-day rolling averages.
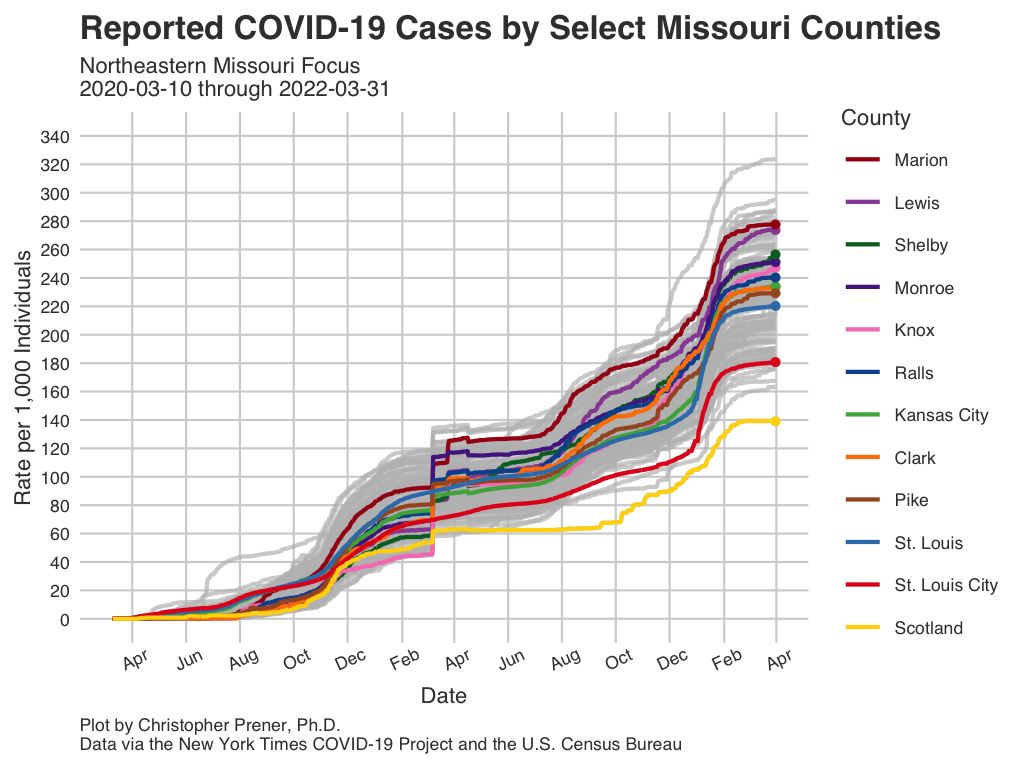
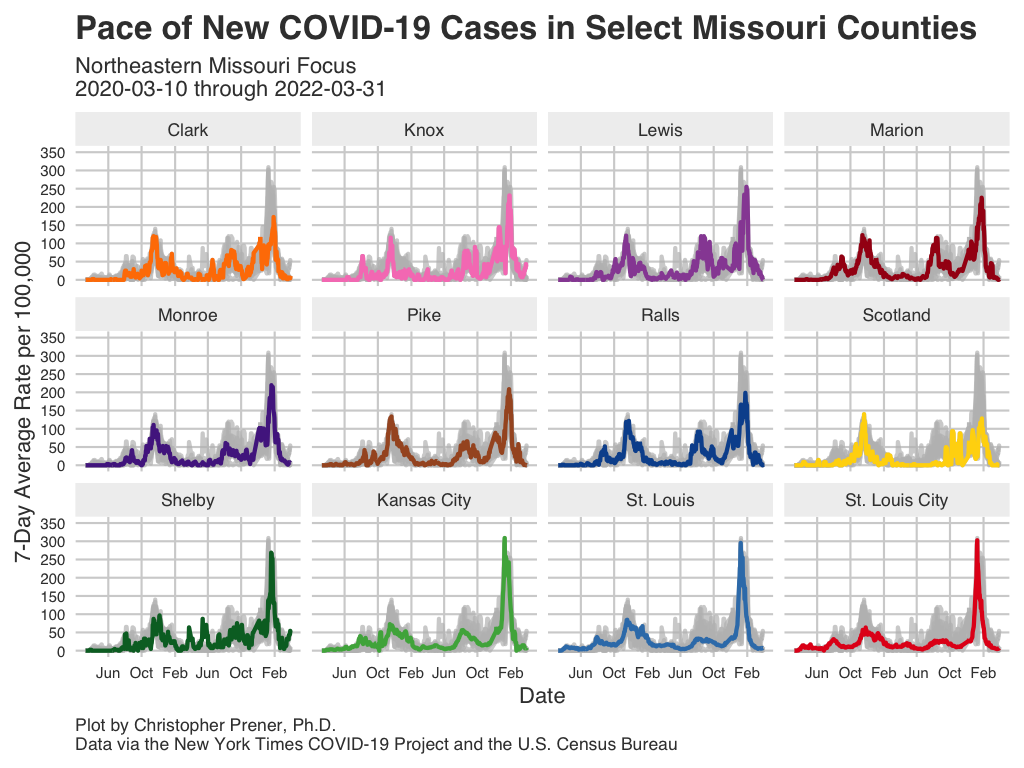
Northeastern Missouri
These plots show patterns in infections for a number of counties in the northeastern part Missouri. These counties lie along the Mississippi River from the St. Louis Metro area north to the Iowa border.
Data Table
Notes
- The underlying data for these plots are available from GitHub in the
county_full.csvtable, which is assembled from data provided by the New York Times. - The FAQ contains short explanations of per-capita rates and log plots.
- All averages presented are 7-day rolling averages.
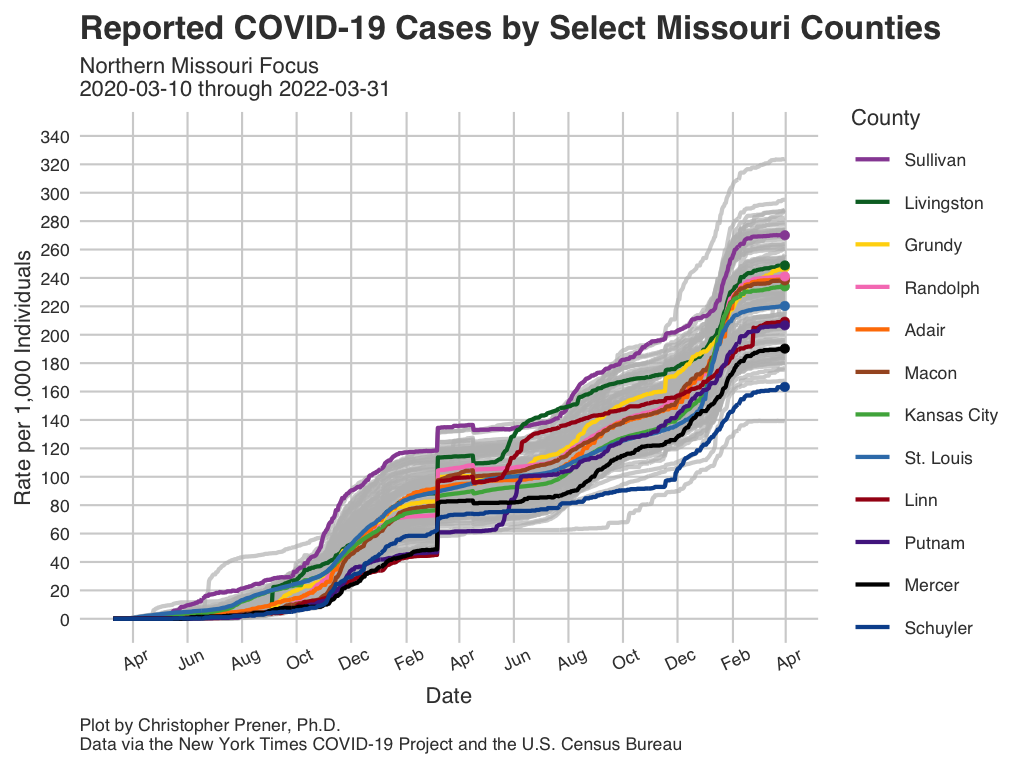
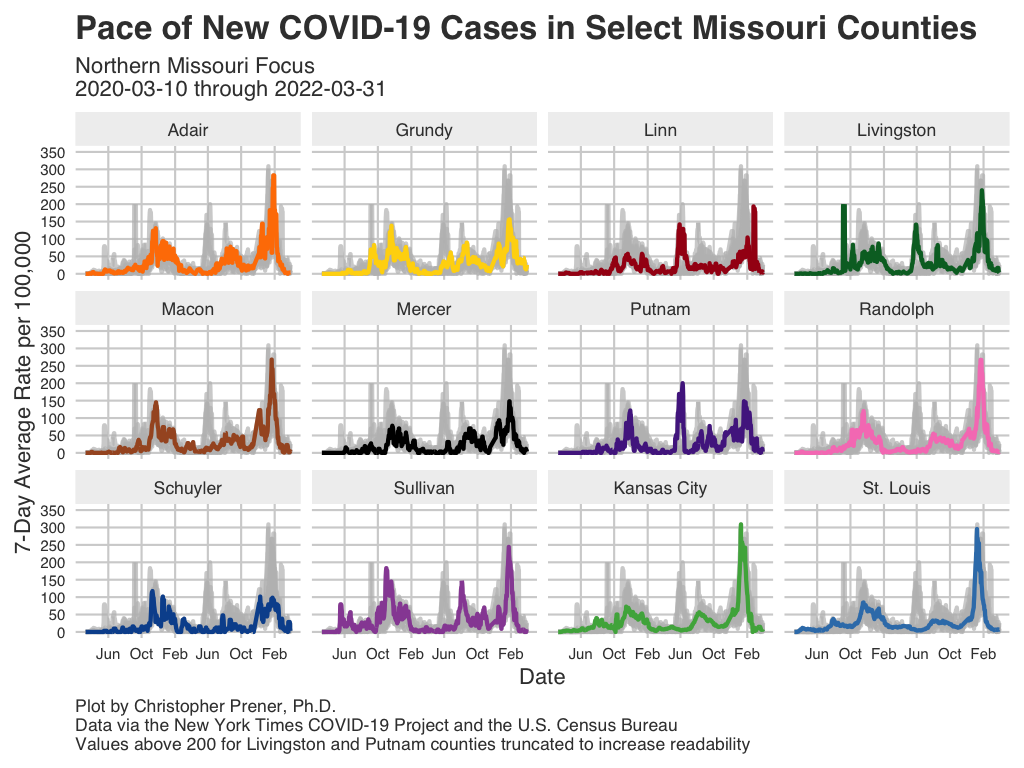
Northern Missouri
These plots show patterns in infections for a number of counties in the northern part Missouri. These counties lie north of the Mid-Missouri region and south of the Iowa border.
Data Table
Notes
- The underlying data for these plots are available from GitHub in the
county_full.csvtable, which is assembled from data provided by the New York Times. - The FAQ contains short explanations of per-capita rates and log plots.
- All averages presented are 7-day rolling averages.
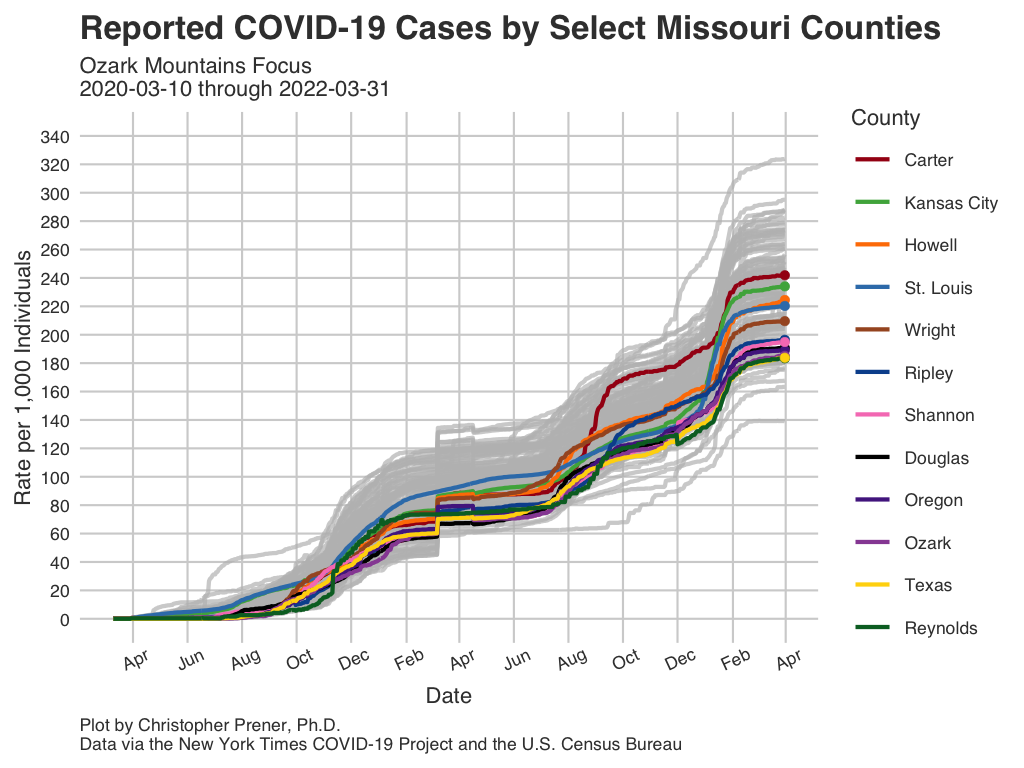
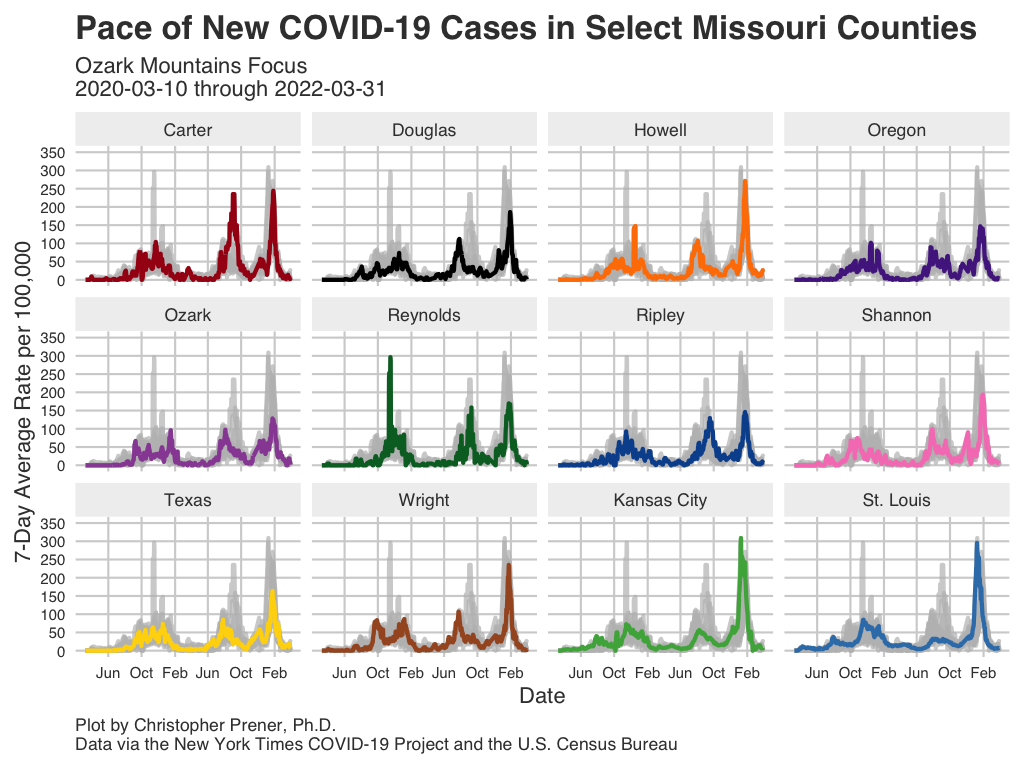
Ozark Mountains
These plots show patterns in infections for a number of counties in the southern part Missouri. These counties lie south and east of the cities of Springfield and Branson.
Data Table
Notes
- The underlying data for these plots are available from GitHub in the
county_full.csvtable, which is assembled from data provided by the New York Times. - The FAQ contains short explanations of per-capita rates and log plots.
- All averages presented are 7-day rolling averages.
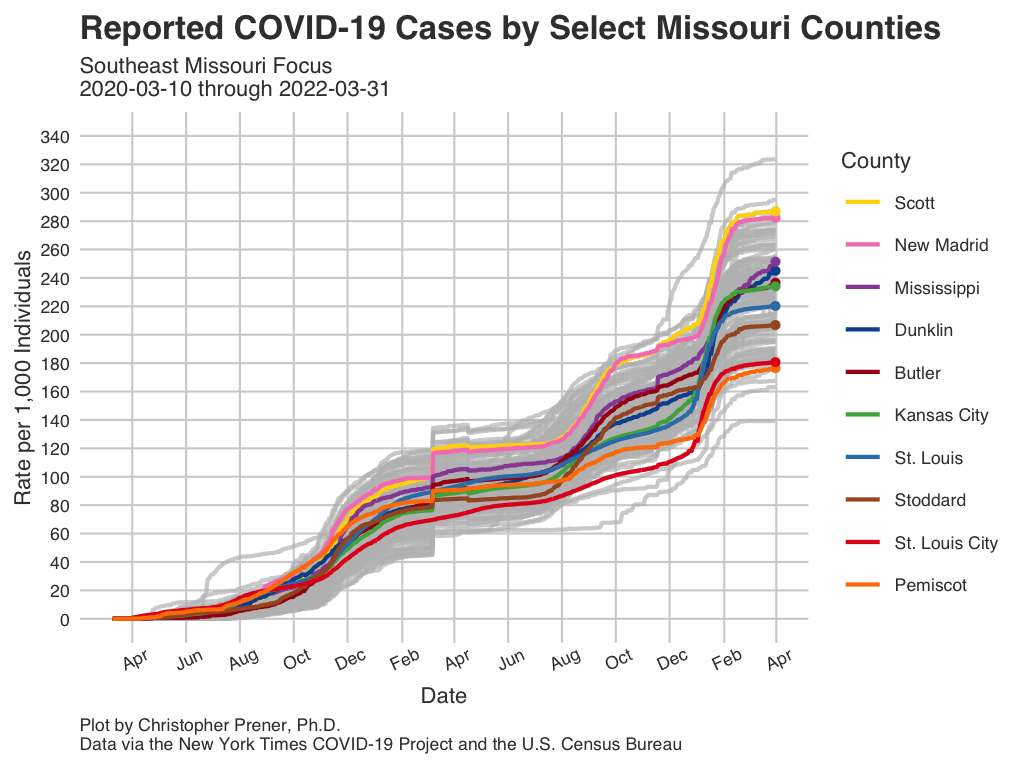
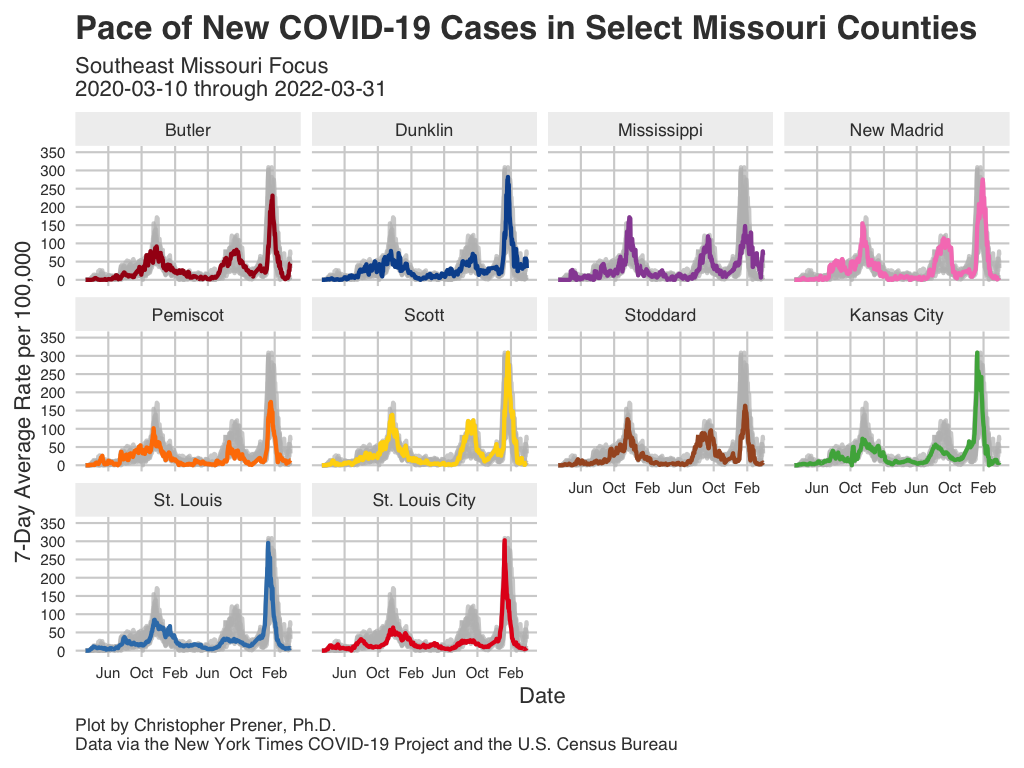
Southeast Missouri
These plots show patterns in infections for a number of counties in the southeastern part Missouri known as the “bootheel.” These counties lie south of the Cape Girardeau metro area along the Mississippi River.
Data Table
Notes
- The underlying data for these plots are available from GitHub in the
county_full.csvtable, which is assembled from data provided by the New York Times. - The FAQ contains short explanations of per-capita rates and log plots.
- All averages presented are 7-day rolling averages.
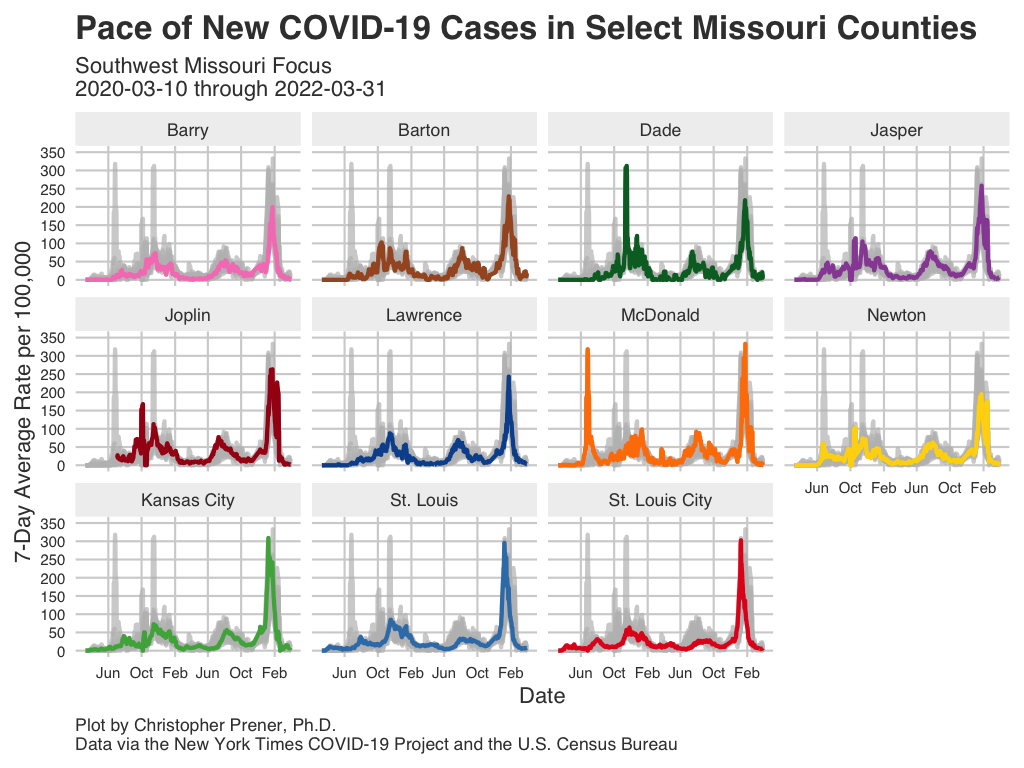
Southwest Missouri
These plots show patterns in infections for a number of counties in the southwestern part Missouri, including parts (but not all of) of the Joplin metro area.

Data Table
Notes
- The underlying data for these plots are available from GitHub in the
county_full.csvtable, which is assembled from data provided by the New York Times. - The FAQ contains short explanations of per-capita rates and log plots.
- All averages presented are 7-day rolling averages.
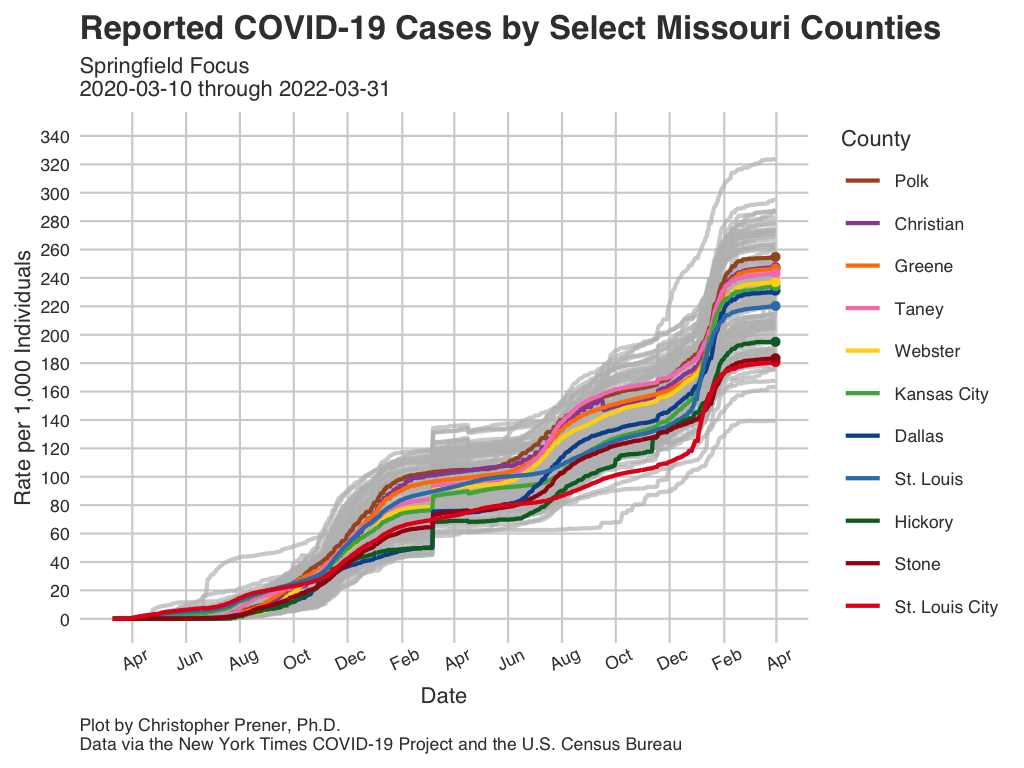
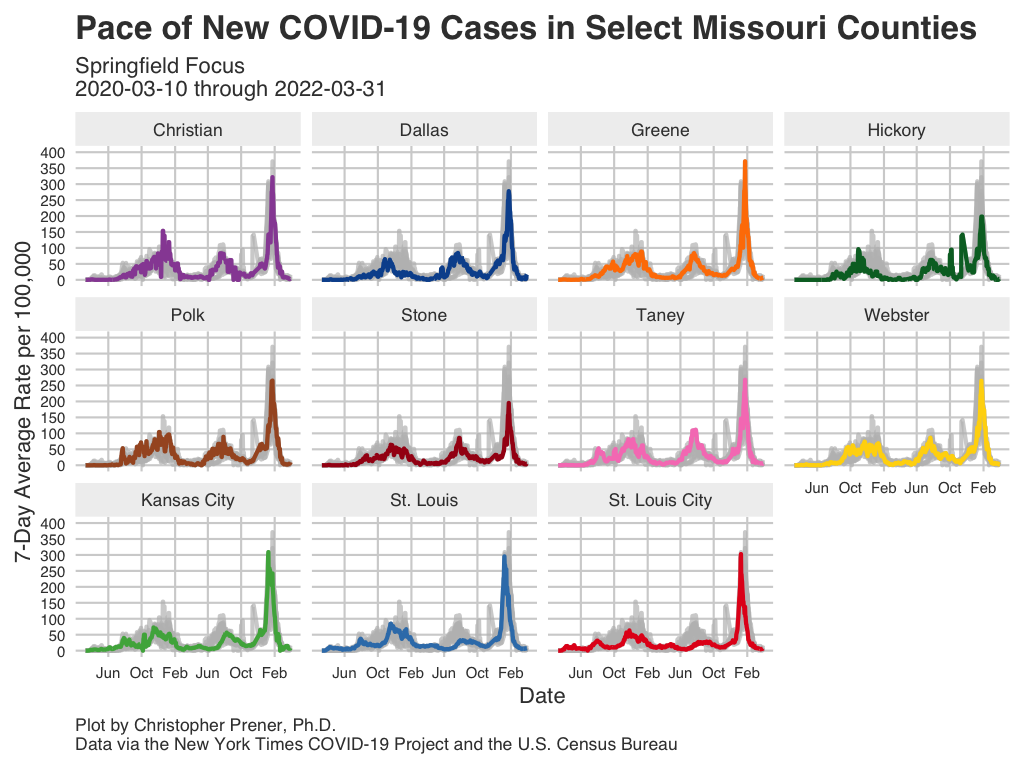
Springfield
These plots show patterns in infections for a number of counties near Springfield and Branson, Missouri. This region lies between Lake of the Ozarks and the Joplin metro, and includes parts (but not all of) of the Springfield metro area.
Data Table
Notes
- The underlying data for these plots are available from GitHub in the
county_full.csvtable, which is assembled from data provided by the New York Times. - The FAQ contains short explanations of per-capita rates and log plots.
- All averages presented are 7-day rolling averages.
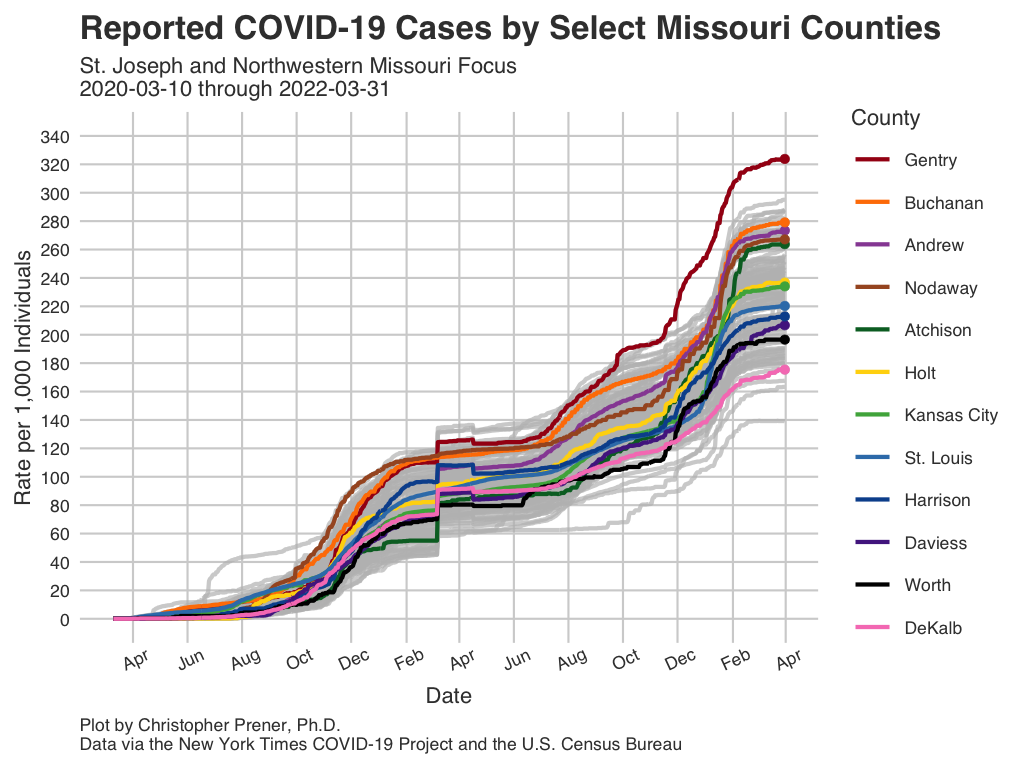
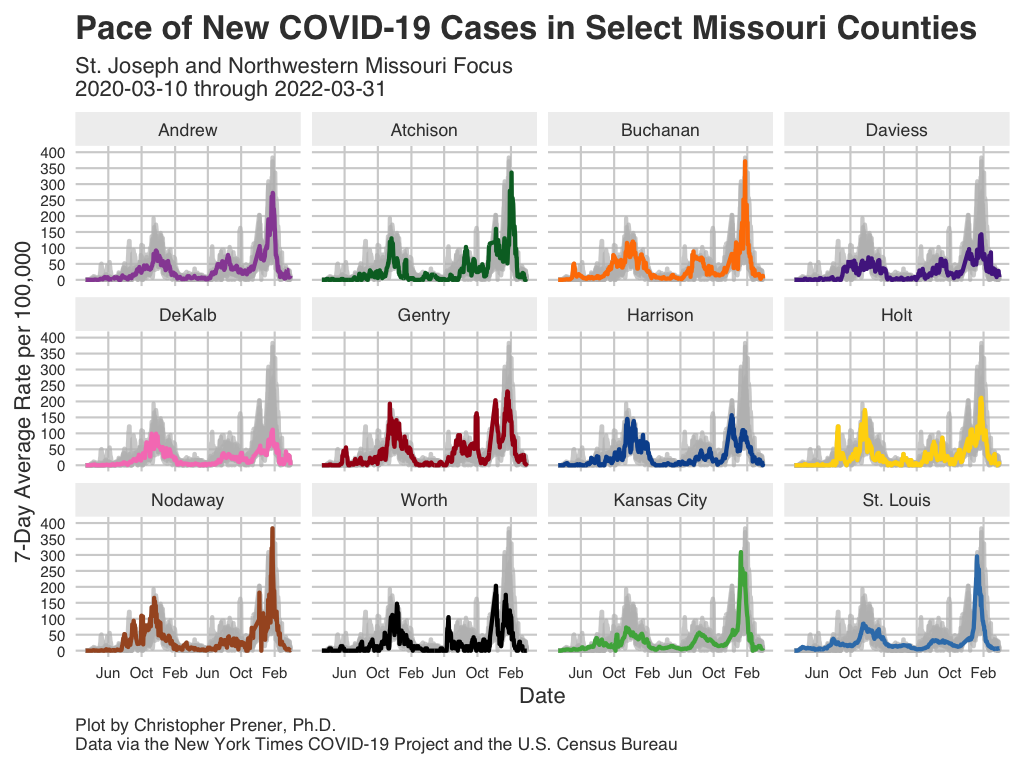
St. Joseph and Northwestern Missouri
These plots show patterns in infections for a number of counties in the northwestern part Missouri, including parts (but not all of) of the St. Joseph metro area. These counties lie just to the north of the Kansas City metro area along the Missouri River.
Data Table
Notes
- The underlying data for these plots are available from GitHub in the
county_full.csvtable, which is assembled from data provided by the New York Times. - The FAQ contains short explanations of per-capita rates and log plots.
- All averages presented are 7-day rolling averages.
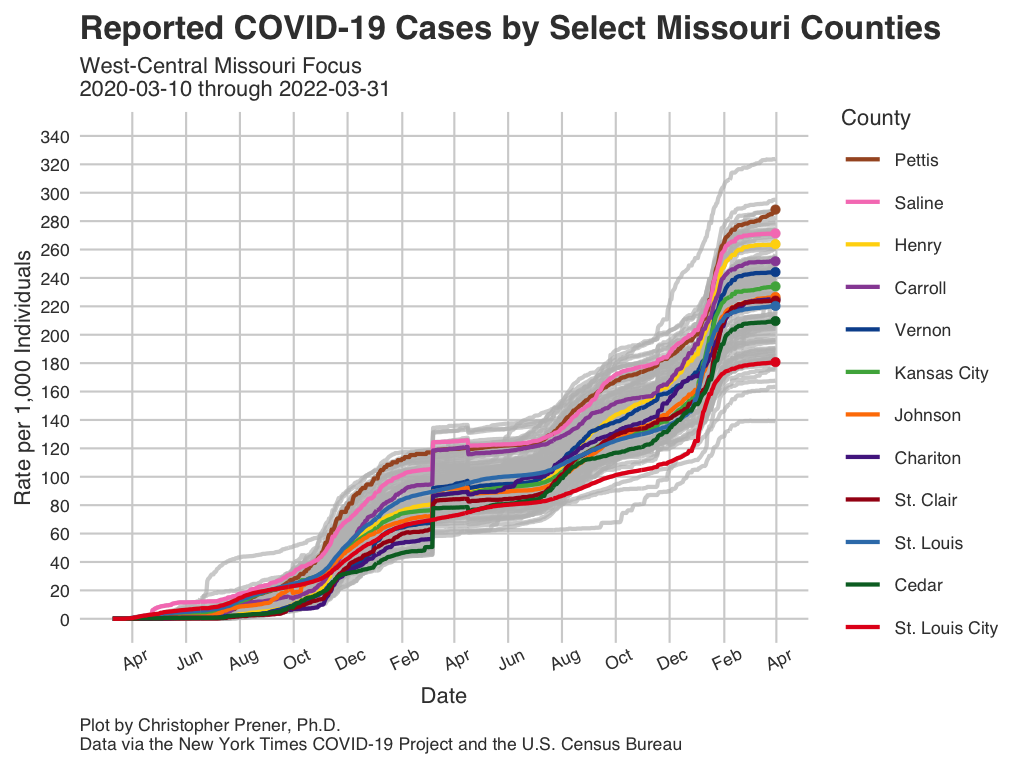
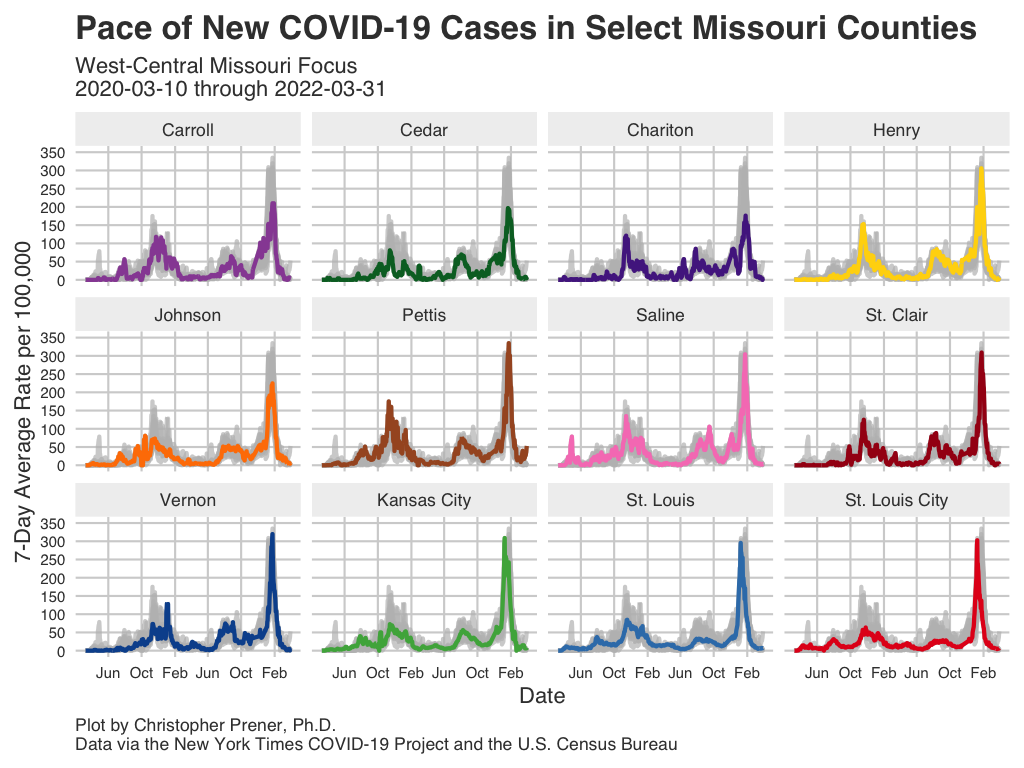
West-Central Missouri
These plots show patterns in infections for a number of counties that lie along the Missouri River between Mid-MO and Kansas City.
Data Table
Notes
- The underlying data for these plots are available from GitHub in the
county_full.csvtable, which is assembled from data provided by the New York Times. - The FAQ contains short explanations of per-capita rates and log plots.
- All averages presented are 7-day rolling averages.
Copyright © 2020-2021 Christopher Prener, Ph.D. All code, data, website content, and images are available under a Creative Commons Attribution 4.0 International License.