Kansas City Metropolitan Area
The following plots and maps focus on the Kansas City metropolitan statistical area, which covers fourteen counties in Missouri and Kansas plus Kansas City, which is treated here as the equivalent of a county.
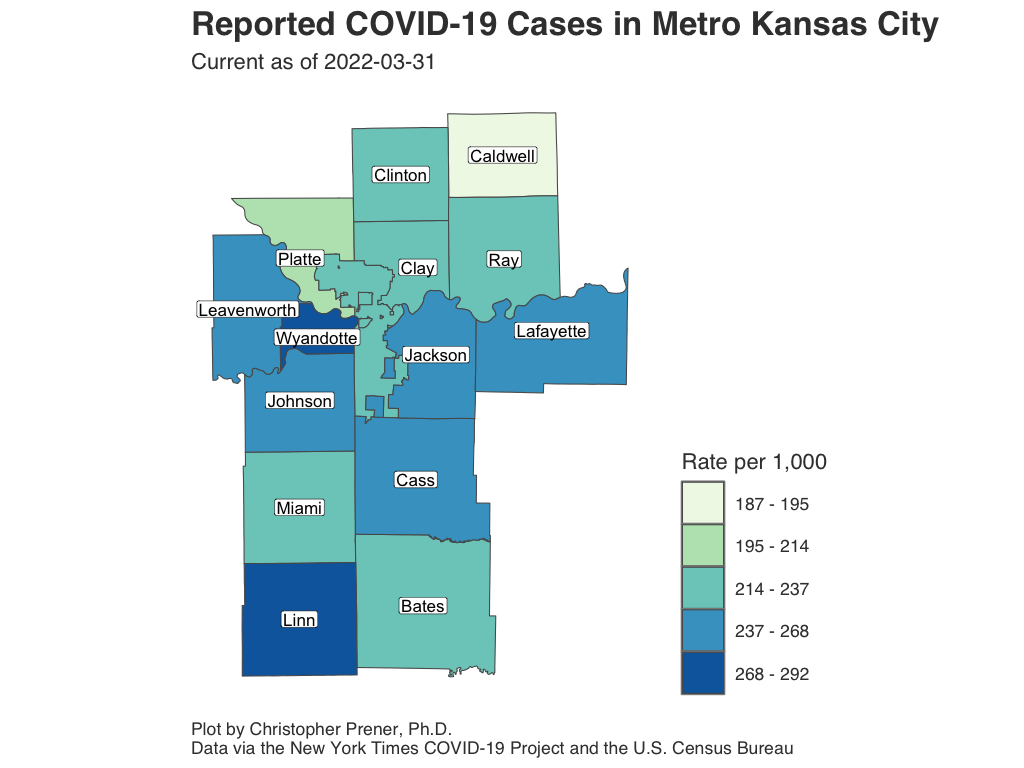
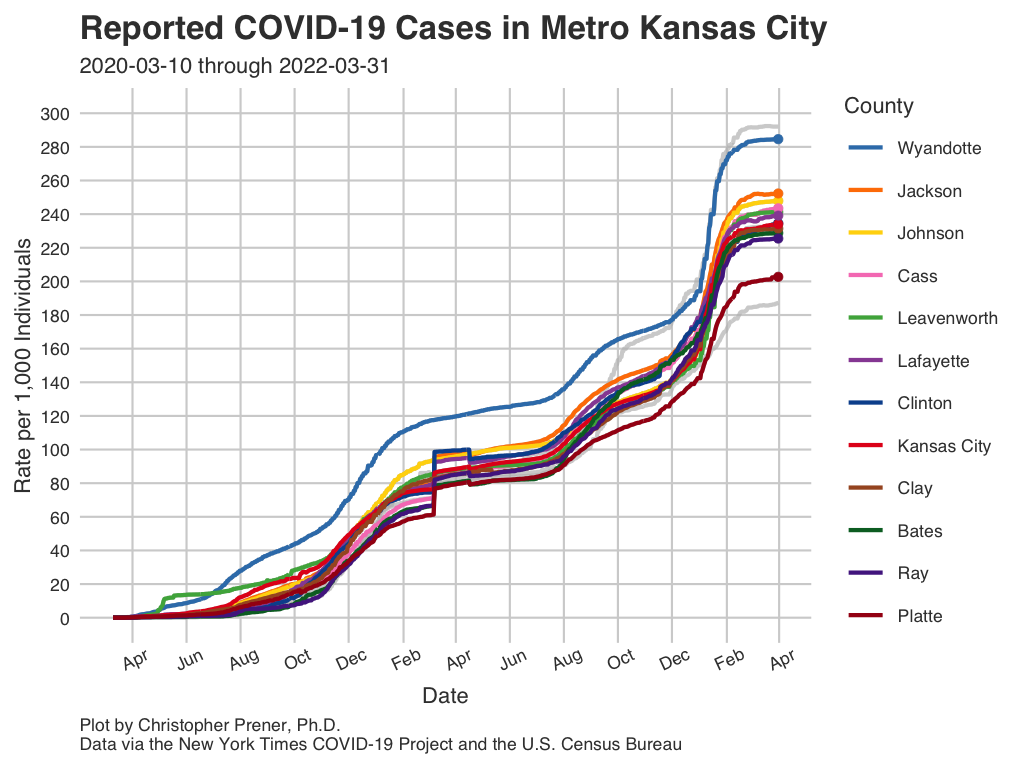
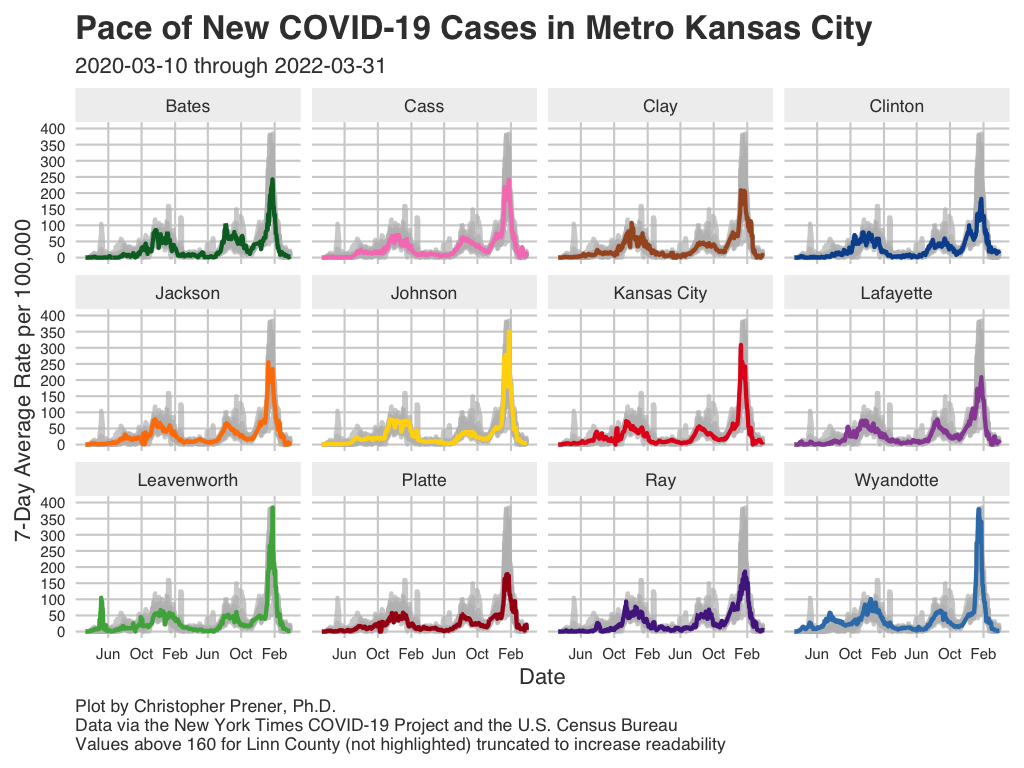
Infections
These plots show patterns in infections for the Kansas City metro area.
Data Table
Notes
- The underlying data for these plots are available from GitHub in the
county_full.csvtable, which is assembled from data provided by the New York Times. - The FAQ contains short explanations of per-capita rates and log plots.
- All averages presented are 7-day rolling averages.
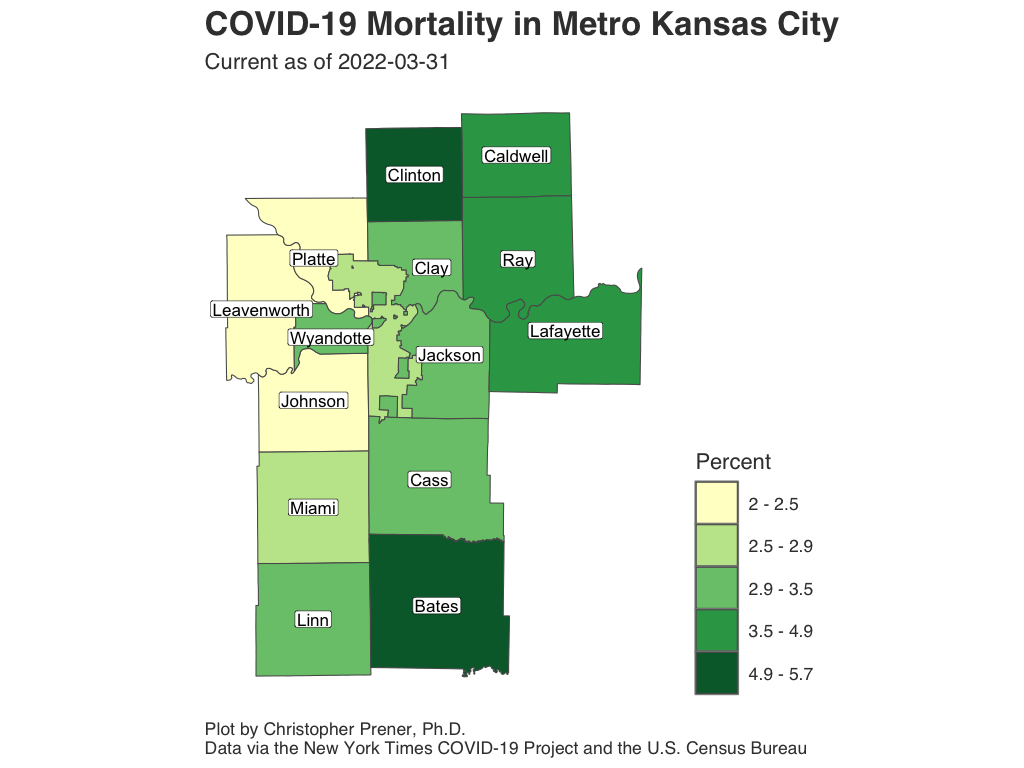
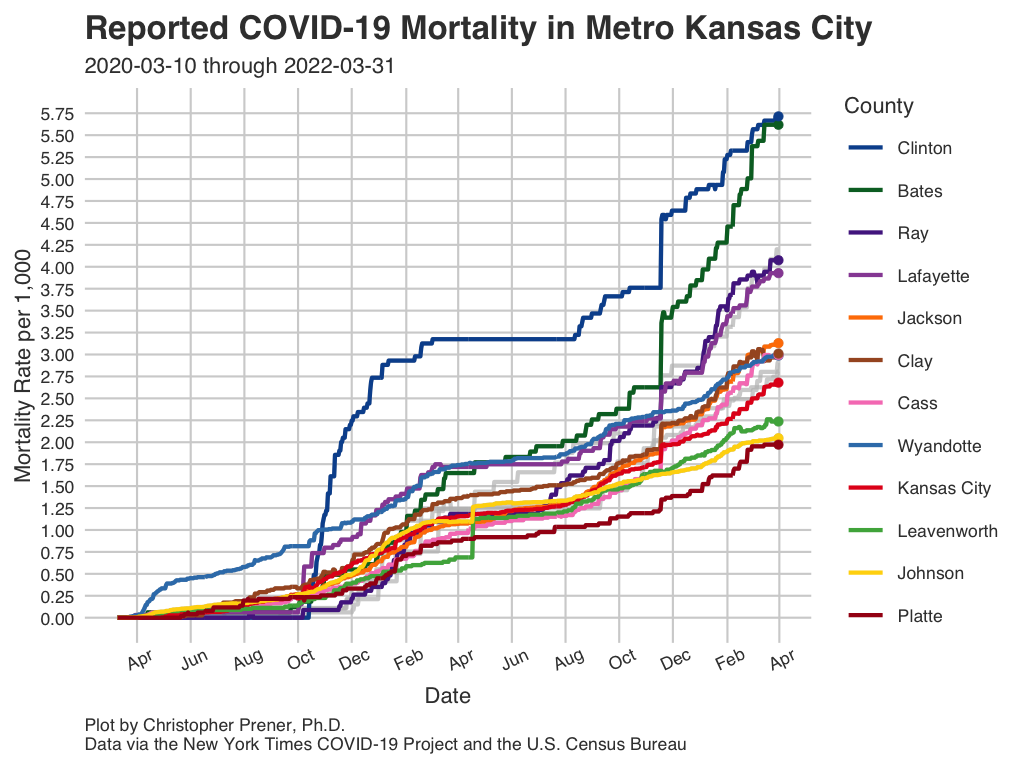
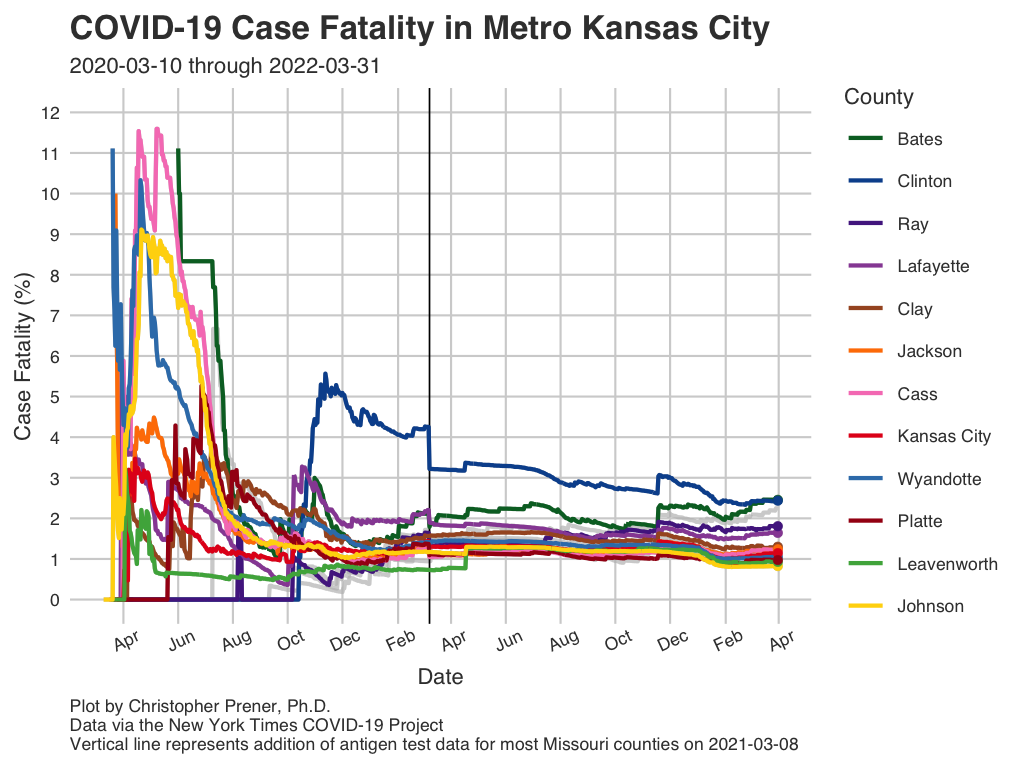
Mortality
These plots show patterns in infections for the Kansas City metro area.
Data Table
Notes
- The underlying data for these plots are available from GitHub in the
county_full.csvtable, which is assembled from data provided by the New York Times. - The FAQ contains short explanations of per-capita rates and log plots.
- All averages presented are 7-day rolling averages.
- The abbreviation “CFR” states for case fatality rate (the number of deaths divided by the number of known cases, expressed as a percentage).
Infection Rates by ZCTA (Zip Code)
This map shows infections as a rate per 1,000 residents for all ZCTAs with five or more patients. It is important not to map the raw counts themselves, but if you want to see those data, click on a ZCTA or the data table.
Interactive Map
Data Table
Notes
- ZCTA stands for “ZIP Code Tabulation Area. These are not identical to zip codes, but they are essential for mapping zip codes as regions on a map.
- The underlying data for these plots are available from GitHub in the
zip_kansas_city.csvtable, which are assembled from data provided by Clay, Johnson, Jackson, Platte, and Wyandotte counties as well as Kansas City itself. These data are also available as a.geojsonfile for mapping. - The FAQ contains a short explanation of per-capita rates.
Copyright © 2020-2021 Christopher Prener, Ph.D. All code, data, website content, and images are available under a Creative Commons Attribution 4.0 International License.