Health Disparities
One striking facet of the COVID-19 outbreak is the effect it has had on communities that have been historically been marginalized in the United States, including African Americans, indigenous nations (the Navajo Nation has one of the highest infection rates in country), and people incarcerated in jails/prisons. What ties these groups together is not inherent biological risk. Rather, disinvestment at the community level means the agencies and organizations that serve these communities often lack the resources needed to prevent the spread of infectious disease. This is long-standing social and health disparities that potentially leave individuals more susceptible to severe illness.
Statewide
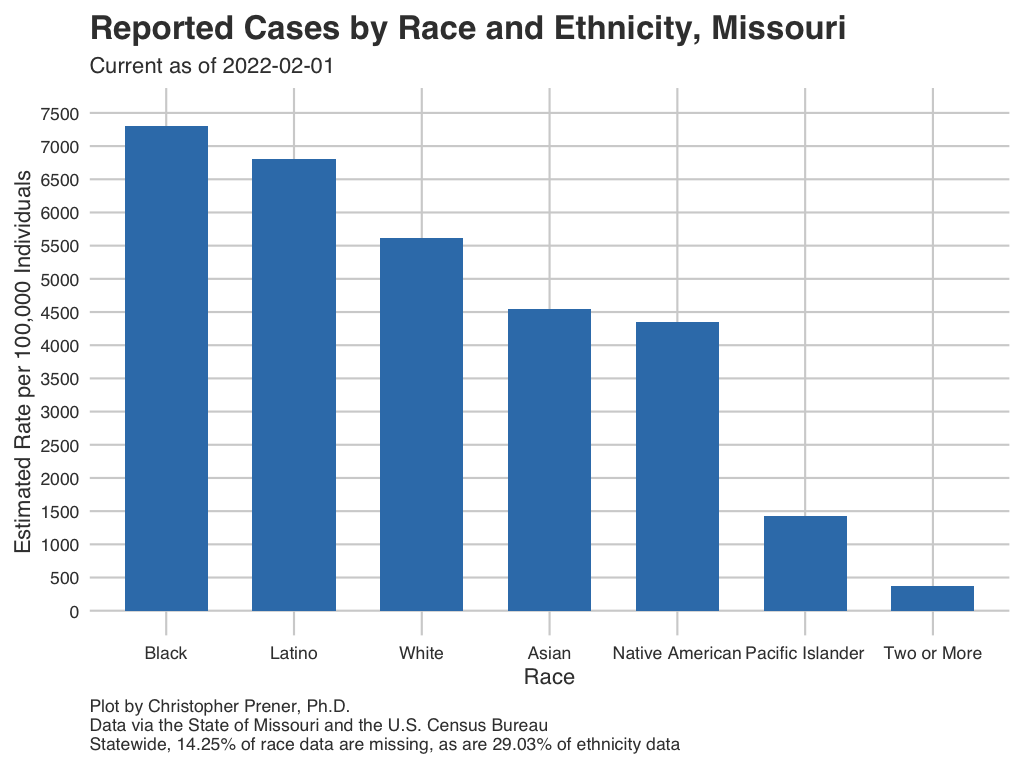
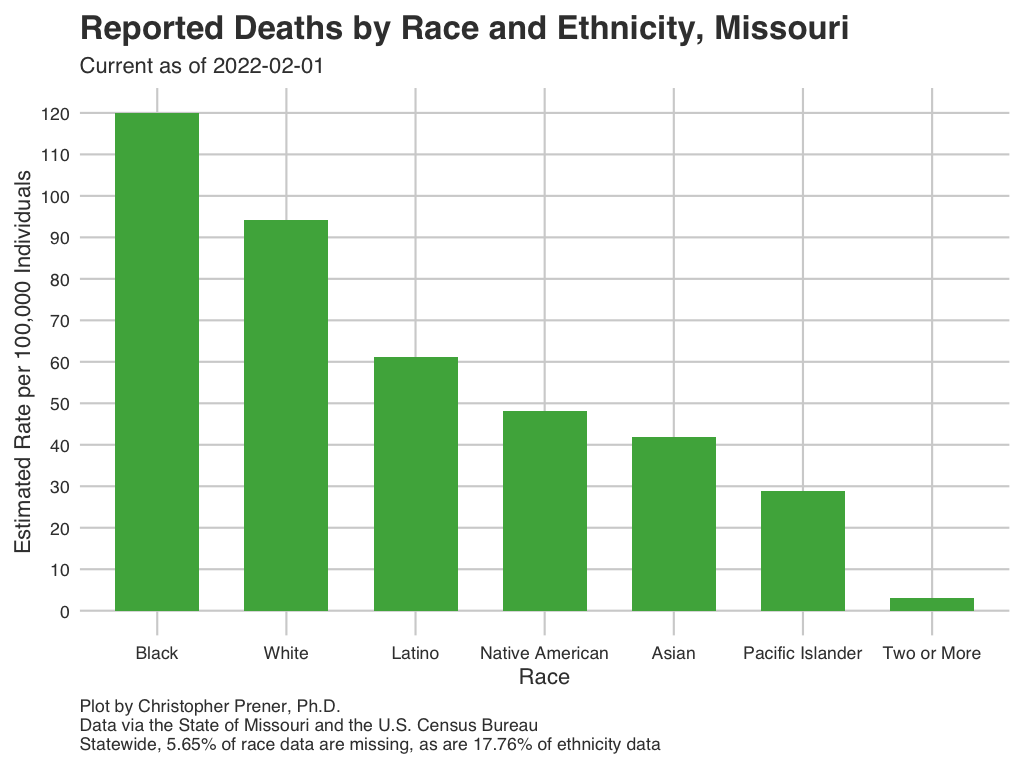
These plots show patterns in infections and mortality by race and ethnicity for the entirety of Missouri.
Data Table
Notes
- The underlying data for these plots are available from GitHub in the
mo_race_rates.csvtable, which is assembled from data provided by the State of Missouri. - The FAQ contains a short explanation of per-capita rates. Note that the rates presented for statewide data are per 100,000 individuals.
- The State of Missouri does not release actual counts for individuals, so these rates are estimated using the current number of positive cases and the percentages provided by the State on their dashboard.
- Rates for other racial identities are combined into an ‘other’ category, which cannot be easily converted to a rate and so is not included here.
- The Latino category is not exclusive of the racial identities shown.
- There is a significant amount of missing data, typically around 16% to 20% on a given day.
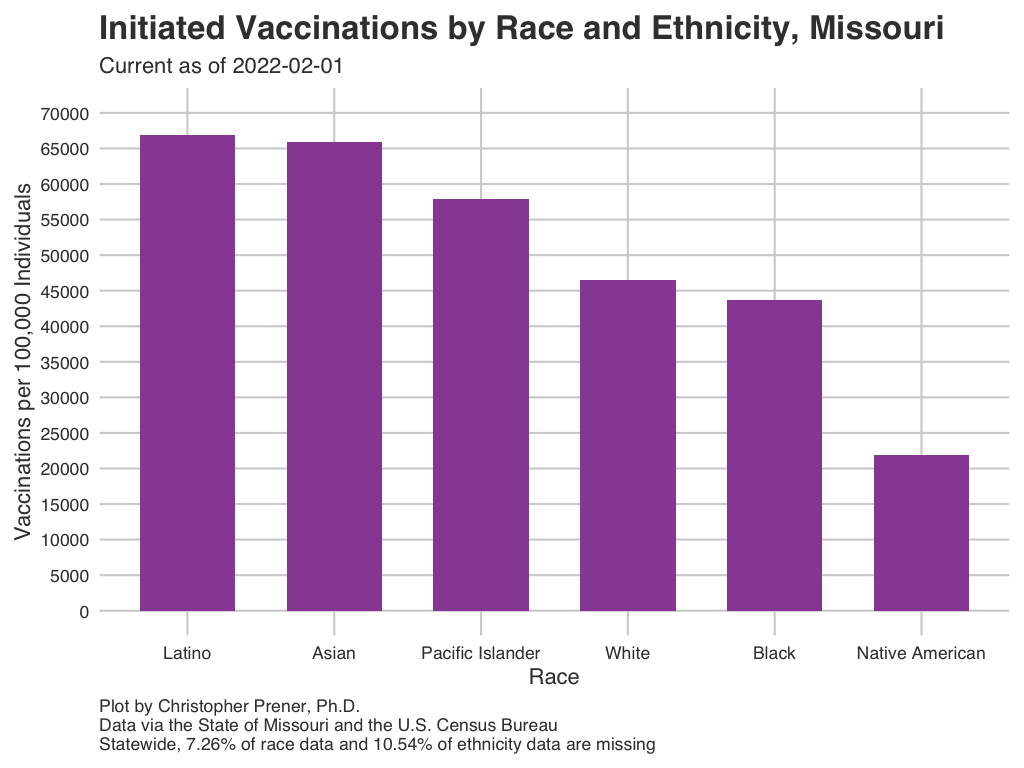
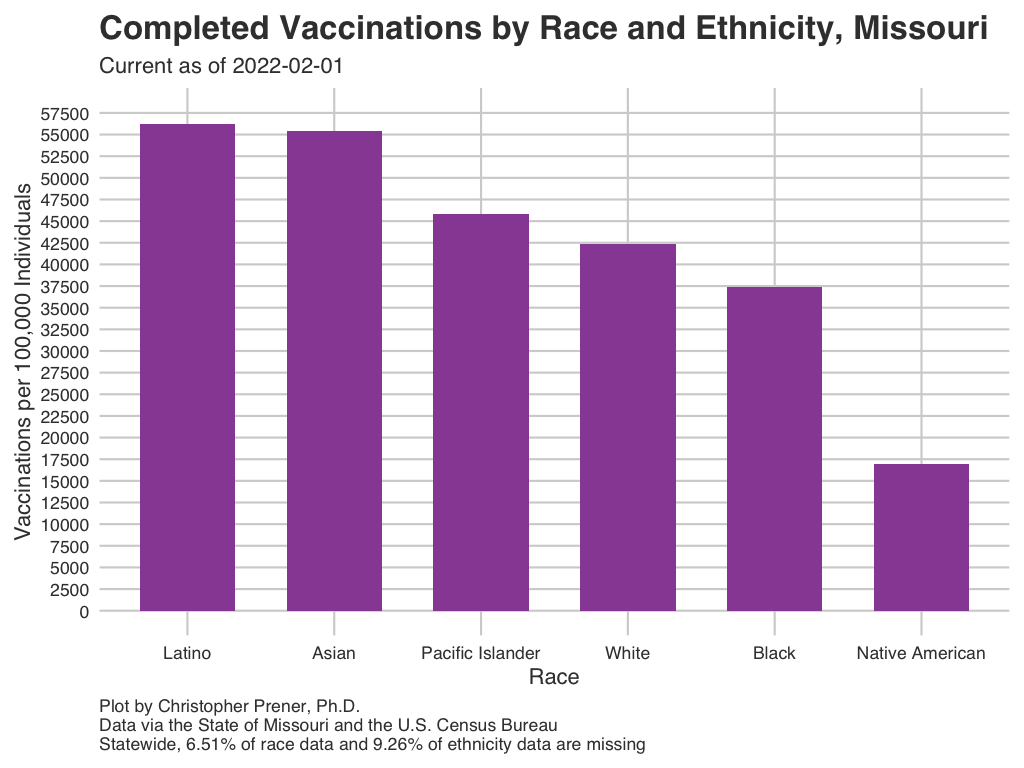
Statewide Vaccinations
Missouri currently releases data on race and ethnicity based on the number of people who have initiated or completed vaccinations. Initiated means individuals have received an initial dose of the Moderna or Pfizer vaccines, or the single dose of the Johnson & Johnson vaccine. Completed means individuals have received both doses of the Moderna or Pfizer vaccines, or the single dose of the Johnson & Johnson vaccine.
Data Table
St. Louis
Within the St. Louis region, I am currently tracking disparities data only for St. Louis City and County.
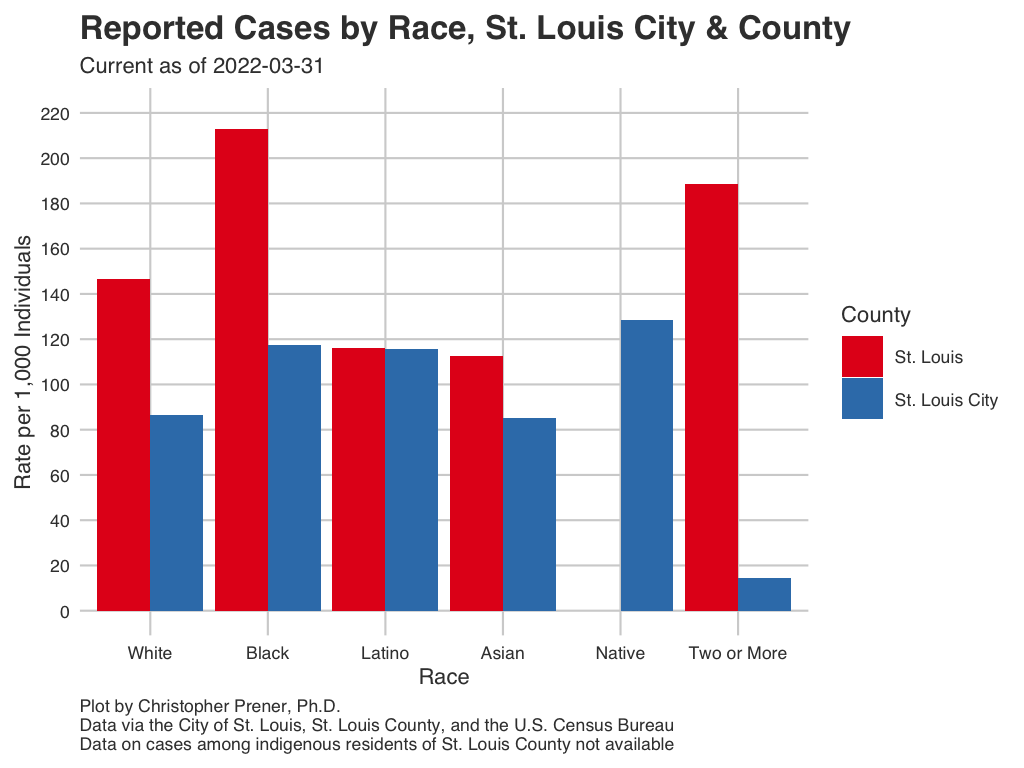
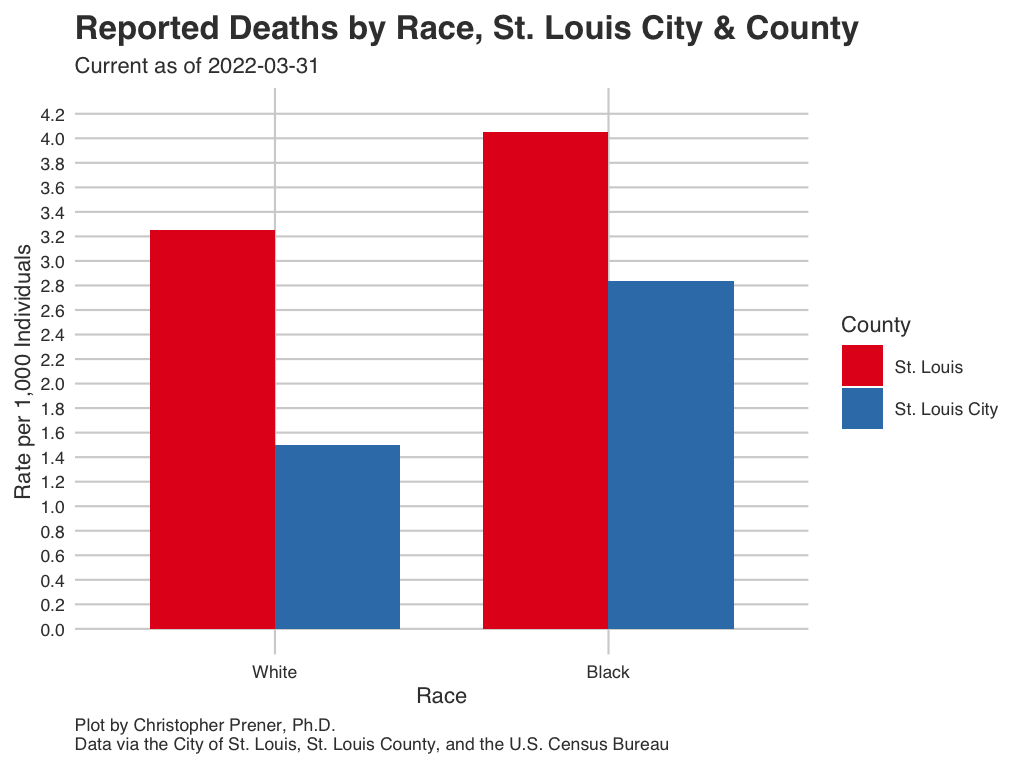
Race
These plots show patterns in infections and mortality by race and ethnicity for St. Louis City and County. Data for St. Louis City and County are not displayed jointly, and so these plots are unique in their comparative presentation of disparities between St. Louis City and County.
Data Table
Notes
- The underlying data for these plots are available from GitHub in the
stl_race_rates.csvtable, which is assembled from data provided by the City of St. Louis and St. Louis County. - The FAQ contains a short explanation of per-capita rates.
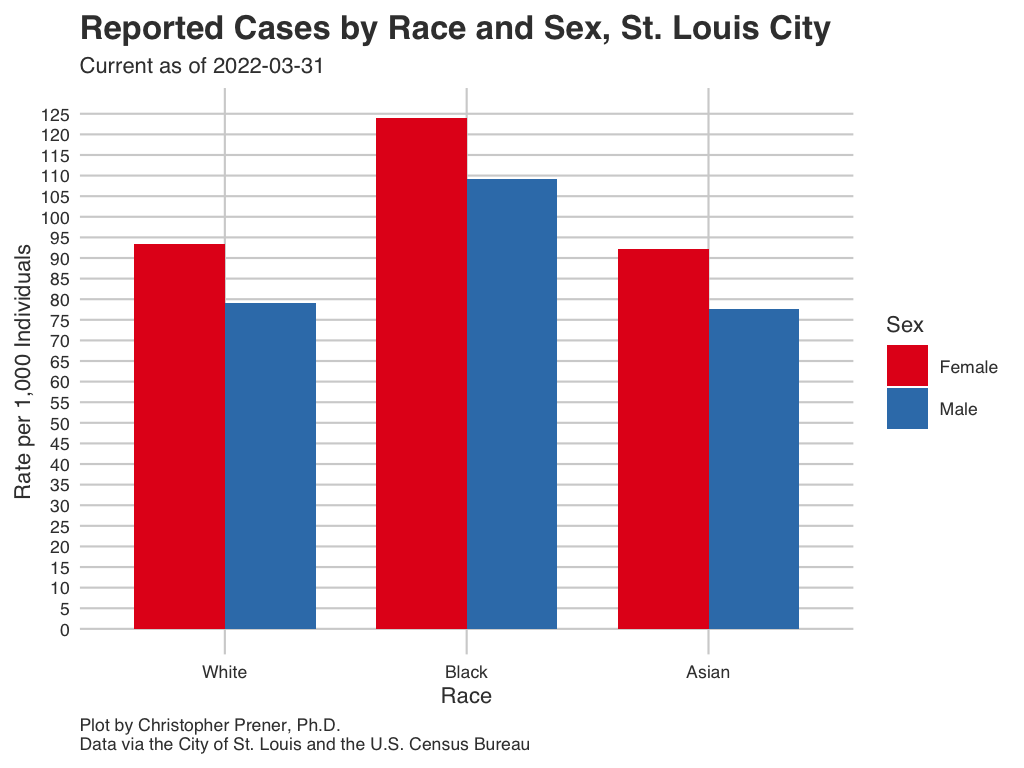
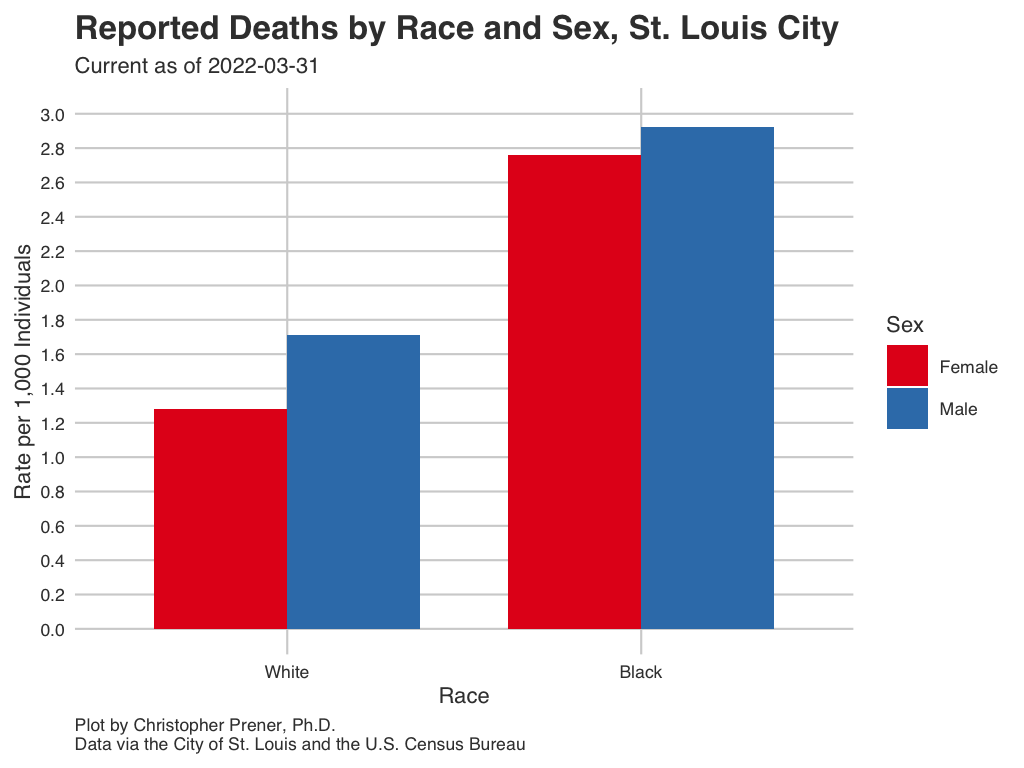
Race and Gender
These plots show patterns in infections and mortality by race and gender for St. Louis City.
Data Table
Notes
- The underlying data for these plots are available from GitHub in the
stl_race_gender_rates.csvtable, which is assembled from data provided by the City of St. Louis. - The FAQ contains a short explanation of per-capita rates.
Copyright © 2020-2021 Christopher Prener, Ph.D. All code, data, website content, and images are available under a Creative Commons Attribution 4.0 International License.