Scraping Vehicle Stop Data
Christopher Prener, Ph.D.
2019-05-13
Source:vignettes/movsr.Rmd
movsr.RmdThe Missouri Attorney General’s Office publishes annual vehicle stop reports. These include agency, county, and state level data on traffic stops conducted by police departments in Missouri, and can be used to track disparities in how these departments perform their duties. Unfortunately the data are not published in a machine readable format. Rather, they are published on tables embedded in the AG’s website. movsr provides functions for scraping these tables and reformatting their contents.
Install
Installing Docker
The web scraping tool used, RSelenium, performs best when Docker is used for headless browsing. Directions are provided on Docker’s website for both macOS and Windows.
Once Docker is installed, a headless browser needs to be pulled and set-up. The selenium project provides a number of options, but Firefox appears to be the best:
Web Scraping with Docker and RSelenium
In order to download tables from the AG’s website, we use Docker as a “headless browser” to pull up the relevant pages (via RSelenium) on the website and then scrape them using rvest (this happens within the movsr functions).
Starting a Headless Browser
Once Docker is installed and started, the following bash command can be used to get a headless browser running on macOS:
Connecting R to the Browser
With a headless browser running, the RSelenium package is used to connect to it. First, we need to load the RSelenium package:
Next, we need to instruct RSelenium to connect to the port we’ve opened using Docker using the remoteDriver() function:
Finally, we need to open that connection with remDr$open():
remDr$open()
#> [1] "Connecting to remote server"
#> $acceptInsecureCerts
#> [1] FALSE
#>
#> $browserName
#> [1] "firefox"
#>
#> $browserVersion
#> [1] "66.0.3"
#>
#> $`moz:accessibilityChecks`
#> [1] FALSE
#>
#> $`moz:geckodriverVersion`
#> [1] "0.24.0"
#>
#> $`moz:headless`
#> [1] FALSE
#>
#> $`moz:processID`
#> [1] 51
#>
#> $`moz:profile`
#> [1] "/tmp/rust_mozprofile.Z0YA0KVLIC9G"
#>
#> $`moz:shutdownTimeout`
#> [1] 60000
#>
#> $`moz:useNonSpecCompliantPointerOrigin`
#> [1] FALSE
#>
#> $`moz:webdriverClick`
#> [1] TRUE
#>
#> $pageLoadStrategy
#> [1] "normal"
#>
#> $platformName
#> [1] "linux"
#>
#> $platformVersion
#> [1] "4.9.87-linuxkit-aufs"
#>
#> $rotatable
#> [1] FALSE
#>
#> $setWindowRect
#> [1] TRUE
#>
#> $strictFileInteractability
#> [1] FALSE
#>
#> $timeouts
#> $timeouts$implicit
#> [1] 0
#>
#> $timeouts$pageLoad
#> [1] 300000
#>
#> $timeouts$script
#> [1] 30000
#>
#>
#> $unhandledPromptBehavior
#> [1] "dismiss and notify"
#>
#> $webdriver.remote.sessionid
#> [1] "9de4421f-9b2e-41cd-86c5-b26d23d00f0f"
#>
#> $id
#> [1] "9de4421f-9b2e-41cd-86c5-b26d23d00f0f"
For details on using RSelenium on other operating systems with Docker, see the relevant vignette on the RSelenium package website.
Scraping Data
With the connection open, we can begin scraping using movsr functions. For example, if we wanted to pull traffic stop counts for the City of St. Louis, we can use mv_get_agency():
# scrape table
slmpd_stops <- mv_get_agency(browser = remDr, agency = 587, statistic = "Stops", pause = 1)head(slmpd_stops)
#> # A tibble: 6 x 4
#> agency cat year value
#> <chr> <chr> <chr> <int>
#> 1 St. Louis City Asian 2000 148
#> 2 St. Louis City Asian 2001 0
#> 3 St. Louis City Asian 2002 441
#> 4 St. Louis City Asian 2003 412
#> 5 St. Louis City Asian 2004 254
#> 6 St. Louis City Asian 2005 488The mv_get_agency() function returns tidy data in “long” format. The "Stops" data returned are the number of stops conducted for each year by race. To convert these into proportions of the total number of stops, we can use mv_reformat()
# reformat table
slmpd_stops <- mv_reformat(slmpd_stops, statistic = "Stops", format = "prop")

# preview table
head(slmpd_stops)
#> # A tibble: 6 x 4
#>   agency         year  cat     value
#>   <chr>          <chr> <chr>   <dbl>
#> 1 St. Louis City 2000  Asian 0.0130
#> 2 St. Louis City 2001  Asian 0
#> 3 St. Louis City 2002  Asian 0.0117
#> 4 St. Louis City 2003  Asian 0.0127
#> 5 St. Louis City 2004  Asian 0.0106
#> 6 St. Louis City 2005  Asian 0.00903
Using proportions or percentage values gives us the proper context for understanding if 441 stops of Asian drivers in 2002 is a large or small number relative to the total number of stops made that year.
Plotting Data
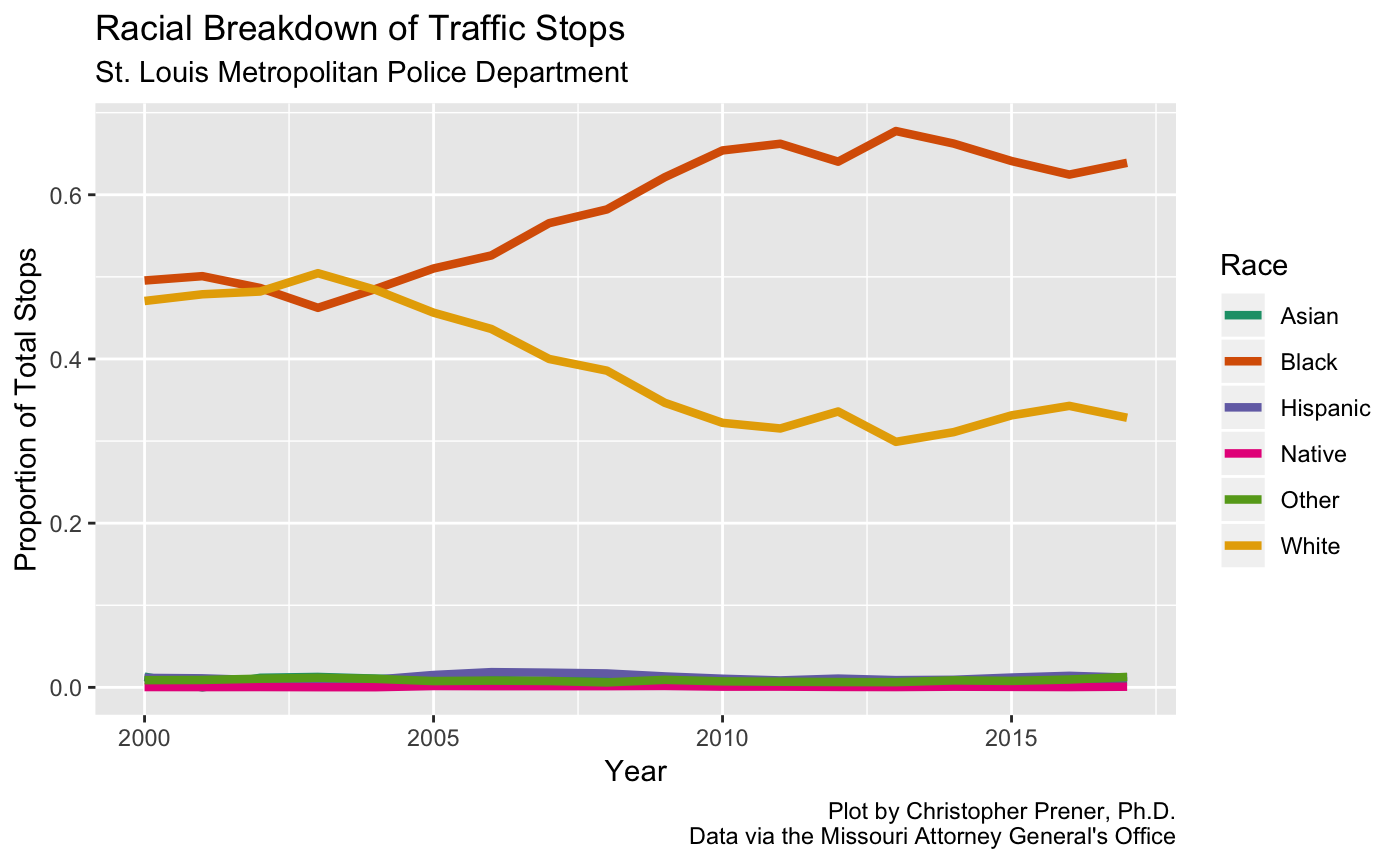
With a data set of proportions created, we can plot the trends in traffic stops by race using ggplot2:
# load dependencies
library(ggplot2)
library(RColorBrewer)

# create plot
ggplot(data = slmpd_stops, mapping = aes(x = as.numeric(year), y = value, color = cat)) +
  geom_line(size = 1.5) +
  scale_colour_brewer(palette = "Dark2", name = "Race") +
  labs(
    title = "Racial Breakdown of Traffic Stops",
    subtitle = "St. Louis Metropolitan Police Department",
    x = "Year",
    y = "Proportion of Total Stops",
    caption = "Plot by Christopher Prener, Ph.D.\nData via the Missouri Attorney General's Office"
  )
Creating Cross Sectional Data Sets
If you want to create a cross-sectional data set, use the mv_batch_agency() function to scrape, reformat, and subset all in one call. This can be fed to the purrr package’s map_df() function along with a vector of police department identification numbers. These numbers can be obtained from the individual agency pages on the annual vehicle stop reports.
The number at the end of the URL is the identification number. For example, the URL for the Jefferson City Police Department is:
https://ago.mo.gov/home/vehicle-stops-report?lea=266The identification number would therefore be 266. If we wanted to download disparity data for Cole County (home of the state capital, Jefferson City), we would need create a vector with the relevant identification numbers:
Only the Cole County Sheriff’s Department and the Jefferson City Police Department reported stops in 2017, and so we’ll limit our vector to those departments.
Next, we create our pipeline with purrr and dplyr functions:
# load dependencies
library(dplyr)
library(purrr)

# create cross-sectional data set
coleCounty %>%
  map_df(~ mv_batch_agency(browser = remDr, agency = .x, statistic = "Disparity", format = "index",
                           category = "Black", year = 2017, pause = 1)) %>%
  rename(disp = value) -> coleCountyDisp
A full example of this workflow, including combining multiple measures into a single data set, can be found at the bottom of the 2017 vehicle stops analysis article.